Exploration and Optimization of Tellurium‐Based Thermoelectrics
Exploration and Optimization of Tellurium‐Based Thermoelectrics
Exploration and Optimization of Tellurium‐Based Thermoelectrics

Create successful ePaper yourself
Turn your PDF publications into a flip-book with our unique Google optimized e-Paper software.
eported that another ternary in this system, TlSbTe2, also undergoes a phase transition – albeit at low<br />
temperatures. [254] Several unsuccessful attempts involving high‐temperature XRD were also<br />
endeavoured to further pursue this issue, but due to sample oxidation <strong>and</strong> additional noise from the<br />
furnace, no reliable data could be produced. Quenching experiments in attempt to freeze the sample’s<br />
state above this temperature are currently underway to learn if there is an identifiable high‐<br />
temperature phase for the Sb compounds.<br />
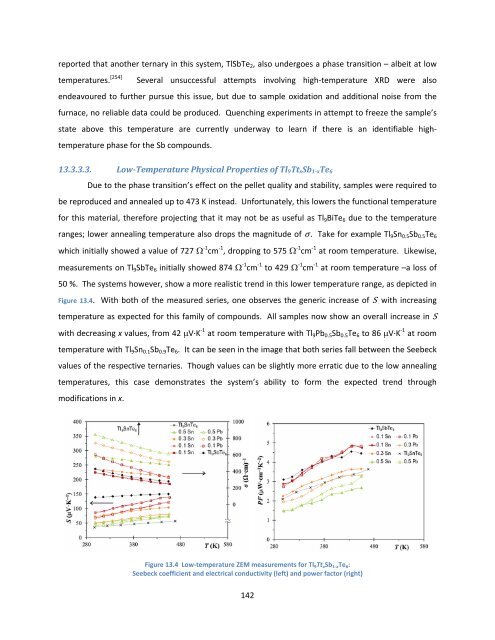
13.3.3.3. Low‐Temperature Physical Properties <strong>of</strong> Tl9TtxSb1‐xTe6<br />
Due to the phase transition’s effect on the pellet quality <strong>and</strong> stability, samples were required to<br />
be reproduced <strong>and</strong> annealed up to 473 K instead. Unfortunately, this lowers the functional temperature<br />
for this material, therefore projecting that it may not be as useful as Tl9BiTe6 due to the temperature<br />
ranges; lower annealing temperature also drops the magnitude <strong>of</strong> σ. Take for example Tl9Sn0.5Sb0.5Te6<br />
which initially showed a value <strong>of</strong> 727 ‐1 cm ‐1 , dropping to 575 ‐1 cm ‐1 at room temperature. Likewise,<br />
measurements on Tl9SbTe6 initially showed 874 ‐1 cm ‐1 to 429 ‐1 cm ‐1 at room temperature –a loss <strong>of</strong><br />
50 %. The systems however, show a more realistic trend in this lower temperature range, as depicted in<br />
Figure 13.4. With both <strong>of</strong> the measured series, one observes the generic increase <strong>of</strong> S with increasing<br />
temperature as expected for this family <strong>of</strong> compounds. All samples now show an overall increase in S<br />
with decreasing x values, from 42 V∙K ‐1 at room temperature with Tl9Pb0.5Sb0.5Te6 to 86 V∙K ‐1 at room<br />
temperature with Tl9Sn0.1Sb0.9Te6. It can be seen in the image that both series fall between the Seebeck<br />
values <strong>of</strong> the respective ternaries. Though values can be slightly more erratic due to the low annealing<br />
temperatures, this case demonstrates the system’s ability to form the expected trend through<br />
modifications in x.<br />
Figure 13.4 Low‐temperature ZEM measurements for Tl 9Tt xSb 1‐xTe 6:<br />
Seebeck coefficient <strong>and</strong> electrical conductivity (left) <strong>and</strong> power factor (right)<br />
142