Exploration and Optimization of Tellurium‐Based Thermoelectrics
Exploration and Optimization of Tellurium‐Based Thermoelectrics
Exploration and Optimization of Tellurium‐Based Thermoelectrics

You also want an ePaper? Increase the reach of your titles
YUMPU automatically turns print PDFs into web optimized ePapers that Google loves.
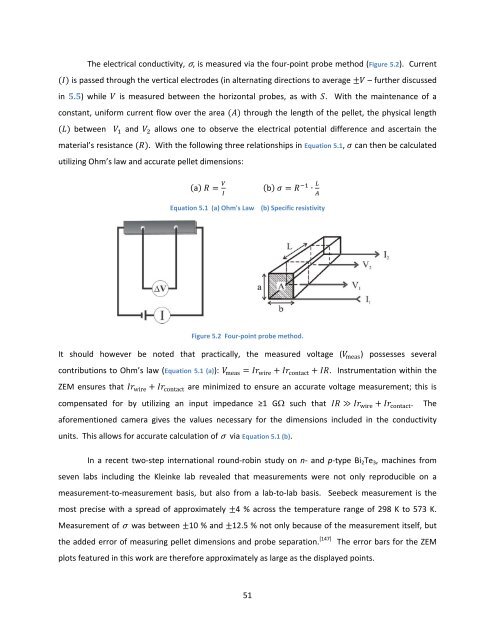
The electrical conductivity, σ, is measured via the four‐point probe method (Figure 5.2). Current<br />
is passed through the vertical electrodes (in alternating directions to average – further discussed<br />
in 5.5) while is measured between the horizontal probes, as with . With the maintenance <strong>of</strong> a<br />
constant, uniform current flow over the area through the length <strong>of</strong> the pellet, the physical length<br />
between <strong>and</strong> allows one to observe the electrical potential difference <strong>and</strong> ascertain the<br />
material’s resistance . With the following three relationships in Equation 5.1, can then be calculated<br />
utilizing Ohm’s law <strong>and</strong> accurate pellet dimensions:<br />
a <br />
b ∙ <br />
<br />
Equation 5.1 (a) Ohm's Law (b) Specific resistivity<br />
Figure 5.2 Four‐point probe method.<br />
It should however be noted that practically, the measured voltage ( meas) possesses several<br />
contributions to Ohm’s law (Equation 5.1 (a)): meas wire contact . Instrumentation within the<br />
ZEM ensures that wire contact are minimized to ensure an accurate voltage measurement; this is<br />
compensated for by utilizing an input impedance ≥1 G such that ≫ wire contact. The<br />
aforementioned camera gives the values necessary for the dimensions included in the conductivity<br />
units. This allows for accurate calculation <strong>of</strong> σ via Equation 5.1 (b).<br />
In a recent two‐step international round‐robin study on n‐ <strong>and</strong> p‐type Bi2Te3, machines from<br />
seven labs including the Kleinke lab revealed that measurements were not only reproducible on a<br />
measurement‐to‐measurement basis, but also from a lab‐to‐lab basis. Seebeck measurement is the<br />
most precise with a spread <strong>of</strong> approximately 4 % across the temperature range <strong>of</strong> 298 K to 573 K.<br />
Measurement <strong>of</strong> σ was between 10 % <strong>and</strong> 12.5 % not only because <strong>of</strong> the measurement itself, but<br />
the added error <strong>of</strong> measuring pellet dimensions <strong>and</strong> probe separation. [147] The error bars for the ZEM<br />
plots featured in this work are therefore approximately as large as the displayed points.<br />
51