Exploration and Optimization of Tellurium‐Based Thermoelectrics
Exploration and Optimization of Tellurium‐Based Thermoelectrics
Exploration and Optimization of Tellurium‐Based Thermoelectrics

You also want an ePaper? Increase the reach of your titles
YUMPU automatically turns print PDFs into web optimized ePapers that Google loves.
The power factor for these compounds is displayed on the right side <strong>of</strong> Figure 12.2. All measured<br />
power factors rise in a similar fashion to the Seebeck coefficients with Bi‐heavy compounds typically<br />
achieving the higher values which is exemplified by Tl9Sn0.2Bi0.8Te6 with a room temperature PF <strong>of</strong> 4.23<br />
µW∙cm ‐1 K ‐2 which increases to 8.08 µW∙cm ‐1 K ‐2 at 587 K. Since , increases in S can be quite<br />
significant, as is the case here. With Tl9Sn0.2Bi0.8Te6 having S = ~80 W∙cm ‐1 K ‐2 at room temperature –<br />
double the value <strong>of</strong> Tl9Sn0.8Bi0.2Te6 – S 2 therefore overpowers its lower σ value.<br />
12.3.3.2. Tl10‐x‐ySnxBiyTe6<br />
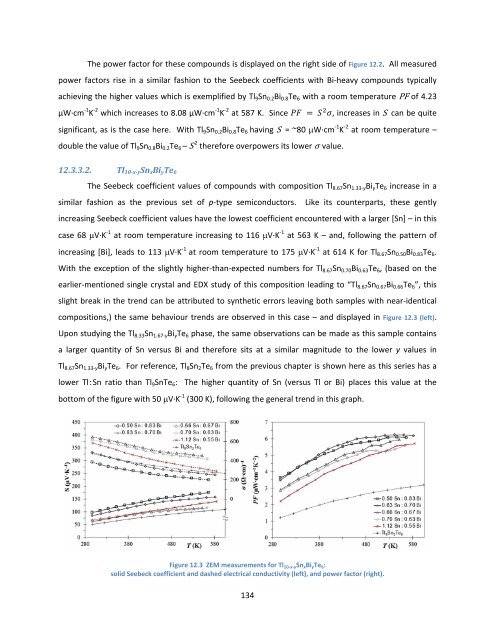
The Seebeck coefficient values <strong>of</strong> compounds with composition Tl8.67Sn1.33‐yBiyTe6 increase in a<br />
similar fashion as the previous set <strong>of</strong> p‐type semiconductors. Like its counterparts, these gently<br />
increasing Seebeck coefficient values have the lowest coefficient encountered with a larger [Sn] – in this<br />
case 68 V∙K ‐1 at room temperature increasing to 116 V∙K ‐1 at 563 K – <strong>and</strong>, following the pattern <strong>of</strong><br />
increasing [Bi], leads to 113 V∙K ‐1 at room temperature to 175 V∙K ‐1 at 614 K for Tl8.67Sn0.50Bi0.83Te6.<br />
With the exception <strong>of</strong> the slightly higher‐than‐expected numbers for Tl8.67Sn0.70Bi0.63Te6, (based on the<br />
earlier‐mentioned single crystal <strong>and</strong> EDX study <strong>of</strong> this composition leading to “Tl8.67Sn0.67Bi0.66Te6”, this<br />
slight break in the trend can be attributed to synthetic errors leaving both samples with near‐identical<br />
compositions,) the same behaviour trends are observed in this case – <strong>and</strong> displayed in Figure 12.3 (left).<br />
Upon studying the Tl8.33Sn1.67‐yBiyTe6 phase, the same observations can be made as this sample contains<br />
a larger quantity <strong>of</strong> Sn versus Bi <strong>and</strong> therefore sits at a similar magnitude to the lower y values in<br />
Tl8.67Sn1.33‐yBiyTe6. For reference, Tl8Sn2Te6 from the previous chapter is shown here as this series has a<br />
lower Tl:Sn ratio than Tl9SnTe6: The higher quantity <strong>of</strong> Sn (versus Tl or Bi) places this value at the<br />
bottom <strong>of</strong> the figure with 50 V∙K ‐1 (300 K), following the general trend in this graph.<br />
Figure 12.3 ZEM measurements for Tl 10‐x‐ySn xBi yTe 6:<br />
solid Seebeck coefficient <strong>and</strong> dashed electrical conductivity (left), <strong>and</strong> power factor (right).<br />
134