LSC South East - lsc.gov.uk - Learning and Skills Council
LSC South East - lsc.gov.uk - Learning and Skills Council
LSC South East - lsc.gov.uk - Learning and Skills Council

You also want an ePaper? Increase the reach of your titles
YUMPU automatically turns print PDFs into web optimized ePapers that Google loves.
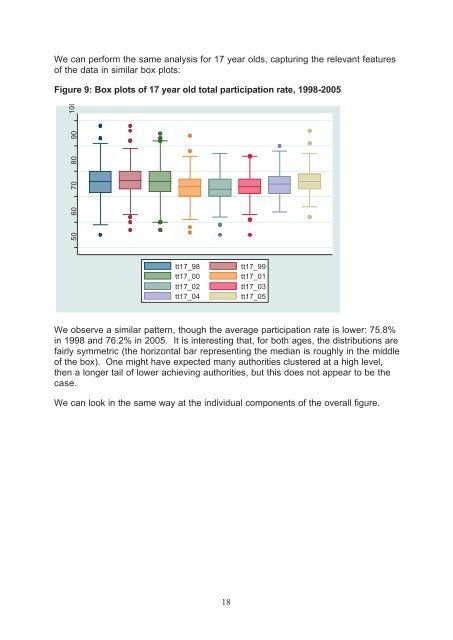
We can perform the same analysis for 17 year olds, capturing the relevant features<br />
of the data in similar box plots:<br />
Figure 9: Box plots of 17 year old total participation rate, 1998-2005<br />
50 60 70 80 90 100<br />
tt17_98 tt17_99<br />
tt17_00 tt17_01<br />
tt17_02 tt17_03<br />
tt17_04 tt17_05<br />
We observe a similar pattern, though the average participation rate is lower: 75.8%<br />
in 1998 <strong>and</strong> 76.2% in 2005. It is interesting that, for both ages, the distributions are<br />
fairly symmetric (the horizontal bar representing the median is roughly in the middle<br />
of the box). One might have expected many authorities clustered at a high level,<br />
then a longer tail of lower achieving authorities, but this does not appear to be the<br />
case.<br />
We can look in the same way at the individual components of the overall figure.<br />
18