LSC South East - lsc.gov.uk - Learning and Skills Council
LSC South East - lsc.gov.uk - Learning and Skills Council
LSC South East - lsc.gov.uk - Learning and Skills Council

Create successful ePaper yourself
Turn your PDF publications into a flip-book with our unique Google optimized e-Paper software.
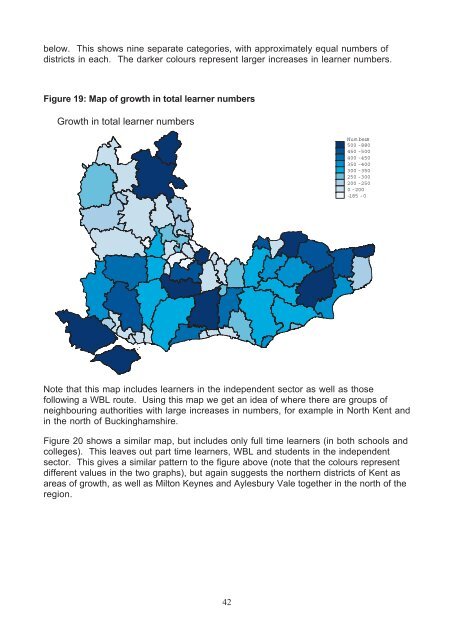
elow. This shows nine separate categories, with approximately equal numbers of<br />
districts in each. The darker colours represent larger increases in learner numbers.<br />
Figure 19: Map of growth in total learner numbers<br />
Growth in total learner numbers<br />
42<br />
Numbers<br />
Num bers<br />
500<br />
500<br />
-<br />
-880<br />
880<br />
450 - 500<br />
450 -500<br />
400<br />
400<br />
-<br />
-450<br />
450<br />
350<br />
350<br />
-<br />
-400<br />
400<br />
300 - 350<br />
300 -350<br />
250<br />
250<br />
-<br />
-300<br />
300<br />
200<br />
200<br />
-<br />
-250<br />
250<br />
0 - 200<br />
0 -200<br />
-185<br />
-185<br />
-<br />
-0<br />
0<br />
Note that this map includes learners in the independent sector as well as those<br />
following a WBL route. Using this map we get an idea of where there are groups of<br />
neighbouring authorities with large increases in numbers, for example in North Kent <strong>and</strong><br />
in the north of Buckinghamshire.<br />
Figure 20 shows a similar map, but includes only full time learners (in both schools <strong>and</strong><br />
colleges). This leaves out part time learners, WBL <strong>and</strong> students in the independent<br />
sector. This gives a similar pattern to the figure above (note that the colours represent<br />
different values in the two graphs), but again suggests the northern districts of Kent as<br />
areas of growth, as well as Milton Keynes <strong>and</strong> Aylesbury Vale together in the north of the<br />
region.