LSC South East - lsc.gov.uk - Learning and Skills Council
LSC South East - lsc.gov.uk - Learning and Skills Council
LSC South East - lsc.gov.uk - Learning and Skills Council

You also want an ePaper? Increase the reach of your titles
YUMPU automatically turns print PDFs into web optimized ePapers that Google loves.
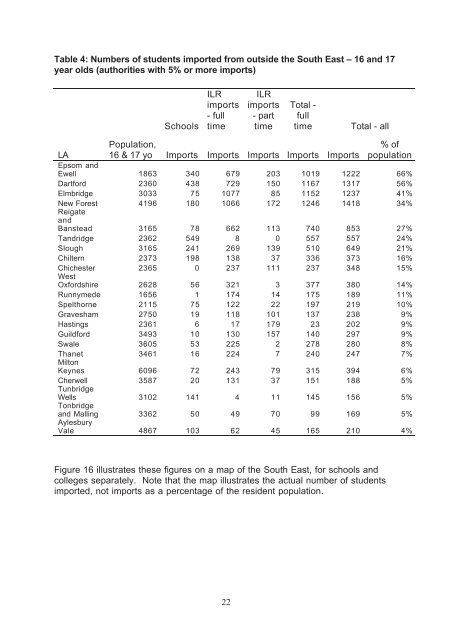
Table 4: Numbers of students imported from outside the <strong>South</strong> <strong>East</strong> – 16 <strong>and</strong> 17<br />
year olds (authorities with 5% or more imports)<br />
LA<br />
Schools<br />
ILR<br />
imports<br />
- full<br />
time<br />
22<br />
ILR<br />
imports<br />
- part<br />
time<br />
Total -<br />
full<br />
time Total - all<br />
Population,<br />
16 & 17 yo Imports Imports Imports Imports Imports<br />
% of<br />
population<br />
Epsom <strong>and</strong><br />
Ewell 1863 340 679 203 1019 1222 66%<br />
Dartford 2360 438 729 150 1167 1317 56%<br />
Elmbridge 3033 75 1077 85 1152 1237 41%<br />
New Forest 4196 180 1066 172 1246 1418 34%<br />
Reigate<br />
<strong>and</strong><br />
Banstead 3165 78 662 113 740 853 27%<br />
T<strong>and</strong>ridge 2362 549 8 0 557 557 24%<br />
Slough 3165 241 269 139 510 649 21%<br />
Chiltern 2373 198 138 37 336 373 16%<br />
Chichester 2365 0 237 111 237 348 15%<br />
West<br />
Oxfordshire 2628 56 321 3 377 380 14%<br />
Runnymede 1656 1 174 14 175 189 11%<br />
Spelthorne 2115 75 122 22 197 219 10%<br />
Gravesham 2750 19 118 101 137 238 9%<br />
Hastings 2361 6 17 179 23 202 9%<br />
Guildford 3493 10 130 157 140 297 9%<br />
Swale 3605 53 225 2 278 280 8%<br />
Thanet 3461 16 224 7 240 247 7%<br />
Milton<br />
Keynes 6096 72 243 79 315 394 6%<br />
Cherwell 3587 20 131 37 151 188 5%<br />
Tunbridge<br />
Wells 3102 141 4 11 145 156 5%<br />
Tonbridge<br />
<strong>and</strong> Malling 3362 50 49 70 99 169 5%<br />
Aylesbury<br />
Vale 4867 103 62 45 165 210 4%<br />
Figure 16 illustrates these figures on a map of the <strong>South</strong> <strong>East</strong>, for schools <strong>and</strong><br />
colleges separately. Note that the map illustrates the actual number of students<br />
imported, not imports as a percentage of the resident population.<br />
Figure 16: Students (16 <strong>and</strong> 17) received from outside the <strong>South</strong> <strong>East</strong><br />
(a) Schools (all full time)