SUMO - Eltis
SUMO - Eltis
SUMO - Eltis

Create successful ePaper yourself
Turn your PDF publications into a flip-book with our unique Google optimized e-Paper software.
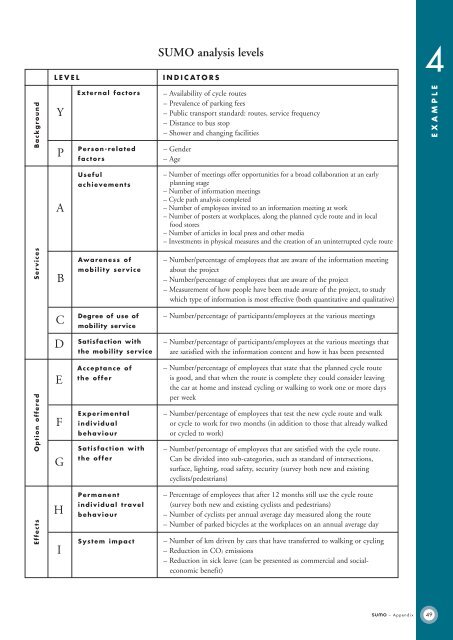
Background<br />
Services<br />
Option offered<br />
Effects<br />
External factors<br />
Person-related<br />
factors<br />
Useful<br />
achievements<br />
<strong>SUMO</strong> analysis levels<br />
LEVEL INDICATORS<br />
Y<br />
P<br />
A<br />
B<br />
C<br />
D<br />
E<br />
F<br />
G<br />
H<br />
I<br />
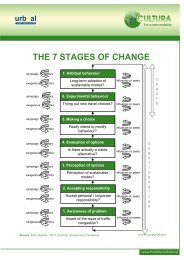
Awareness of<br />
mobility service<br />
Degree of use of<br />
mobility service<br />
Satisfaction with<br />
the mobility service<br />
Acceptance of<br />
the offer<br />
Experimental<br />
individual<br />
behaviour<br />
Satisfaction with<br />
the offer<br />
Permanent<br />
individual travel<br />
behaviour<br />
System impact<br />
– Availability of cycle routes<br />
– Prevalence of parking fees<br />
– Public transport standard: routes, service frequency<br />
– Distance to bus stop<br />
– Shower and changing facilities<br />
– Gender<br />
– Age<br />
– Number of meetings offer opportunities for a broad collaboration at an early<br />
planning stage<br />
– Number of information meetings<br />
– Cycle path analysis completed<br />
– Number of employees invited to an information meeting at work<br />
– Number of posters at workplaces, along the planned cycle route and in local<br />
food stores<br />
– Number of articles in local press and other media<br />
– Investments in physical measures and the creation of an uninterrupted cycle route<br />
– Number/percentage of employees that are aware of the information meeting<br />
about the project<br />
– Number/percentage of employees that are aware of the project<br />
– Measurement of how people have been made aware of the project, to study<br />
which type of information is most effective (both quantitative and qualitative)<br />
– Number/percentage of participants/employees at the various meetings<br />
– Number/percentage of participants/employees at the various meetings that<br />
are satisfied with the information content and how it has been presented<br />
– Number/percentage of employees that state that the planned cycle route<br />
is good, and that when the route is complete they could consider leaving<br />
the car at home and instead cycling or walking to work one or more days<br />
per week<br />
– Number/percentage of employees that test the new cycle route and walk<br />
or cycle to work for two months (in addition to those that already walked<br />
or cycled to work)<br />
– Number/percentage of employees that are satisfied with the cycle route.<br />
Can be divided into sub-categories, such as standard of intersections,<br />
surface, lighting, road safety, security (survey both new and existing<br />
cyclists/pedestrians)<br />
– Percentage of employees that after 12 months still use the cycle route<br />
(survey both new and existing cyclists and pedestrians)<br />
– Number of cyclists per annual average day measured along the route<br />
– Number of parked bicycles at the workplaces on an annual average day<br />
– Number of km driven by cars that have transferred to walking or cycling<br />
– Reduction in CO2 emissions<br />
– Reduction in sick leave (can be presented as commercial and socialeconomic<br />
benefit)<br />
sumo – Appendix 49<br />
4<br />
EXAMPLE