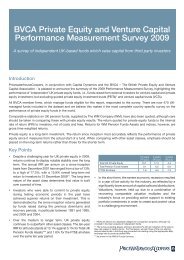
BVCA Private Equity and Venture Capital ... - BVCA admin
BVCA Private Equity and Venture Capital ... - BVCA admin
BVCA Private Equity and Venture Capital ... - BVCA admin

Create successful ePaper yourself
Turn your PDF publications into a flip-book with our unique Google optimized e-Paper software.
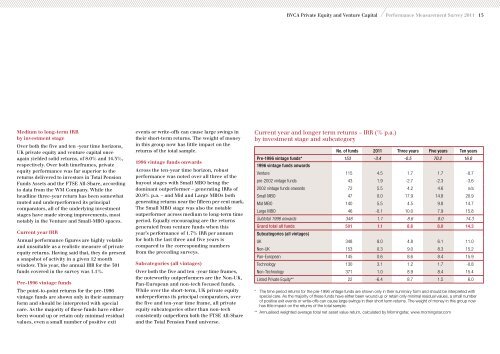
Medium to long-term IRR<br />
by investment stage<br />
Over both the five <strong>and</strong> ten -year time horizons,<br />
UK private equity <strong>and</strong> venture capital once<br />
again yielded solid returns, of 8.0% <strong>and</strong> 14.3%,<br />
respectively. Over both timeframes, private<br />
equity performance was far superior to the<br />
returns delivered to investors in Total Pension<br />
Funds Assets <strong>and</strong> the FTSE All-Share, according<br />
to data from the WM Company. While the<br />
headline three-year return has been somewhat<br />
muted <strong>and</strong> underperformed its principal<br />
comparators, all of the underlying investment<br />
stages have made strong improvements, most<br />
notably in the <strong>Venture</strong> <strong>and</strong> Small-MBO spaces.<br />
Current year IRR<br />
Annual performance figures are highly volatile<br />
<strong>and</strong> unsuitable as a realistic measure of private<br />
equity returns. Having said that, they do present<br />
a snapshot of activity in a given 12 month<br />
window. This year, the annual IRR for the 501<br />
funds covered in the survey was 1.1%.<br />
Pre-1996 vintage funds<br />
The point-to-point returns for the pre-1996<br />
vintage funds are shown only in their summary<br />
form <strong>and</strong> should be interpreted with special<br />
care. As the majority of these funds have either<br />
been wound up or retain only minimal residual<br />
values, even a small number of positive exit<br />
events or write-offs can cause large swings in<br />
their short-term returns. The weight of money<br />
in this group now has little impact on the<br />
returns of the total sample.<br />
1996 vintage funds onwards<br />
Across the ten-year time horizon, robust<br />
performance was noted over all three of the<br />
buyout stages with Small MBO being the<br />
dominant outperformer – generating IRRs of<br />
20.9% p.a. – <strong>and</strong> Mid <strong>and</strong> Large MBOs both<br />
generating returns near the fifteen per cent mark.<br />
The Small MBO stage was also the notable<br />
outperformer across medium to long-term time<br />
period. Equally encouraging are the returns<br />
generated from venture funds when this<br />
year’s performance of 1.7% IRR per annum<br />
for both the last three <strong>and</strong> five years is<br />
compared to the corresponding numbers<br />
from the preceding surveys.<br />
Subcategories (all vintages)<br />
Over both the five <strong>and</strong> ten -year time frames,<br />
the noteworthy outperformers are the Non-UK,<br />
Pan-European <strong>and</strong> non-tech focused funds.<br />
While over the short-term, UK private equity<br />
underperforms its principal comparators, over<br />
the five <strong>and</strong> ten-year time frame, all private<br />
equity subcategories other than non-tech<br />
consistently outperform both the FTSE All-Share<br />
<strong>and</strong> the Total Pension Fund universe.<br />
<strong>BVCA</strong> <strong>Private</strong> <strong>Equity</strong> <strong>and</strong> <strong>Venture</strong> <strong>Capital</strong> Performance Measurement Survey 2011 15<br />
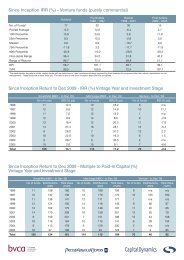
Current year <strong>and</strong> longer term returns – IRR (% p.a.)<br />
by investment stage <strong>and</strong> subcategory<br />
No. of funds 2011 Three years Five years Ten years<br />
Pre-1996 vintage funds*<br />
1996 vintage funds onwards<br />
153 -3.4 -0.5 70.2 16.0<br />
<strong>Venture</strong> 115 4.5 1.7 1.7 -0.7<br />
pre-2002 vintage funds 43 1.9 -2.7 -2.3 -3.6<br />
2002 vintage funds onwards 72 5.5 4.2 4.6 n/a<br />
Small MBO 47 0.0 17.9 14.8 20.9<br />
Mid MBO 140 5.5 4.5 9.8 14.7<br />
Large MBO 46 -0.1 10.0 7.9 15.8<br />
Subtotal 1996 onwards 348 1.1 8.6 8.0 14.3<br />
Gr<strong>and</strong> total all funds<br />
Subcategories (all vintages)<br />
501 1.1 8.6 8.0 14.3<br />
UK 348 8.0 4.8 6.1 11.0<br />
Non-UK 153 0.3 9.0 8.3 15.2<br />
Pan-European 145 0.6 8.6 8.4 15.9<br />
Technology 130 3.1 1.2 1.7 -0.8<br />
Non-Technology 371 1.0 8.9 8.4 15.4<br />
Listed <strong>Private</strong> <strong>Equity</strong>** 22 -6.4 8.7 1.5 6.0<br />
* The time period returns for the pre-1996 vintage funds are shown only in their summary form <strong>and</strong> should be interpreted with<br />
special care. As the majority of these funds have either been wound up or retain only minimal residual values, a small number<br />
of positive exit events or write-offs can cause large swings in their short term returns. The weight of money in this group now<br />
has little impact on the returns of the total sample.<br />
** Annualised weighted average total net asset value return, calculated by Morningstar, www.morningstar.com