BVCA Private Equity and Venture Capital ... - BVCA admin
BVCA Private Equity and Venture Capital ... - BVCA admin
BVCA Private Equity and Venture Capital ... - BVCA admin

Create successful ePaper yourself
Turn your PDF publications into a flip-book with our unique Google optimized e-Paper software.
30 <strong>BVCA</strong> <strong>Private</strong> <strong>Equity</strong> <strong>and</strong> <strong>Venture</strong> <strong>Capital</strong> Performance Measurement Survey 2011<br />
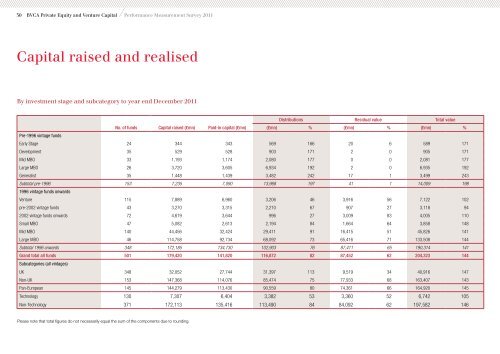
<strong>Capital</strong> raised <strong>and</strong> realised<br />
By investment stage <strong>and</strong> subcategory to year end December 2011<br />
Please note that total figures do not necessarily equal the sum of the components due to rounding.<br />
Distributions Residual value Total value<br />
No. of funds <strong>Capital</strong> raised (£mn) Paid-in capital (£mn) (£mn) % (£mn) % (£mn) %<br />
Pre-1996 vintage funds<br />
Early Stage 24 344 343 569 166 20 6 589 171<br />
Development 35 529 528 903 171 2 0 905 171<br />
Mid MBO 33 1,193 1,174 2,080 177 0 0 2,081 177<br />
Large MBO 26 3,720 3,605 6,934 192 2 0 6,935 192<br />
Generalist 35 1,448 1,439 3,482 242 17 1 3,499 243<br />
Subtotal pre-1996<br />
1996 vintage funds onwards<br />
153 7,235 7,090 13,968 197 41 1 14,009 198<br />
<strong>Venture</strong> 115 7,889 6,960 3,206 46 3,916 56 7,122 102<br />
pre-2002 vintage funds 43 3,270 3,315 2,210 67 907 27 3,118 94<br />
2002 vintage funds onwards 72 4,619 3,644 996 27 3,009 83 4,005 110<br />
Small MBO 47 5,082 2,613 2,194 84 1,664 64 3,858 148<br />
Mid MBO 140 44,456 32,424 29,411 91 16,415 51 45,826 141<br />
Large MBO 46 114,758 92,734 68,092 73 65,416 71 133,508 144<br />
Subtotal 1996 onwards 348 172,185 134,730 102,903 76 87,411 65 190,314 141<br />
Gr<strong>and</strong> total all funds<br />
Subcategories (all vintages)<br />
501 179,420 141,820 116,872 82 87,452 62 204,323 144<br />
UK 348 32,052 27,744 31,397 113 9,519 34 40,916 147<br />
Non-UK 153 147,368 114,076 85,474 75 77,933 68 163,407 143<br />
Pan-European 145 144,279 113,430 90,559 80 74,361 66 164,920 145<br />
Technology 130 7,307 6,404 3,382 53 3,360 52 6,742 105<br />
Non-Technology 371 172,113 135,416 113,490 84 84,092 62 197,582 146