BVCA Private Equity and Venture Capital ... - BVCA admin
BVCA Private Equity and Venture Capital ... - BVCA admin
BVCA Private Equity and Venture Capital ... - BVCA admin

Create successful ePaper yourself
Turn your PDF publications into a flip-book with our unique Google optimized e-Paper software.
<strong>BVCA</strong> <strong>Private</strong> <strong>Equity</strong> <strong>and</strong> <strong>Venture</strong> <strong>Capital</strong> Performance Measurement Survey 2011 39<br />
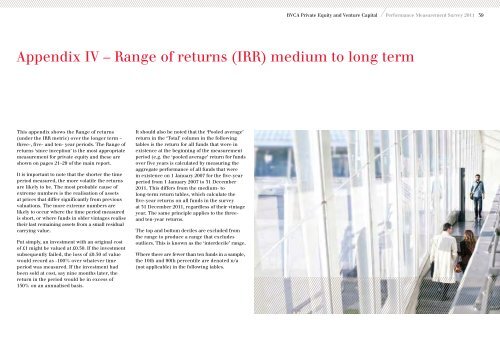
Appendix IV – Range of returns (IRR) medium to long term<br />
This appendix shows the Range of returns<br />
(under the IRR metric) over the longer term –<br />
three-, five- <strong>and</strong> ten- year periods. The Range of<br />
returns ‘since inception’ is the most appropriate<br />
measurement for private equity <strong>and</strong> these are<br />
shown on pages 21–29 of the main report.<br />
It is important to note that the shorter the time<br />
period measured, the more volatile the returns<br />
are likely to be. The most probable cause of<br />
extreme numbers is the realisation of assets<br />
at prices that differ significantly from previous<br />
valuations. The more extreme numbers are<br />
likely to occur where the time period measured<br />
is short, or where funds in older vintages realise<br />
their last remaining assets from a small residual<br />
carrying value.<br />
Put simply, an investment with an original cost<br />
of £1 might be valued at £0.50. If the investment<br />
subsequently failed, the loss of £0.50 of value<br />
would record as -100% over whatever time<br />
period was measured. If the investment had<br />
been sold at cost, say nine months later, the<br />
return in the period would be in excess of<br />
150% on an annualised basis.<br />
It should also be noted that the ‘Pooled average’<br />
return in the ‘Total’ column in the following<br />
tables is the return for all funds that were in<br />
existence at the beginning of the measurement<br />
period (e.g. the ‘pooled average’ return for funds<br />
over five years is calculated by measuring the<br />
aggregate performance of all funds that were<br />
in existence on 1 January 2007 for the five-year<br />
period from 1 January 2007 to 31 December<br />
2011. This differs from the medium- to<br />
long-term return tables, which calculate the<br />
five-year returns on all funds in the survey<br />
at 31 December 2011, regardless of their vintage<br />
year. The same principle applies to the three-<br />
<strong>and</strong> ten-year returns.<br />
The top <strong>and</strong> bottom deciles are excluded from<br />
the range to produce a range that excludes<br />
outliers. This is known as the ‘interdecile’ range.<br />
Where there are fewer than ten funds in a sample,<br />
the 10th <strong>and</strong> 90th percentile are denoted n/a<br />
(not applicable) in the following tables.