BVCA Private Equity and Venture Capital ... - BVCA admin
BVCA Private Equity and Venture Capital ... - BVCA admin
BVCA Private Equity and Venture Capital ... - BVCA admin

Create successful ePaper yourself
Turn your PDF publications into a flip-book with our unique Google optimized e-Paper software.
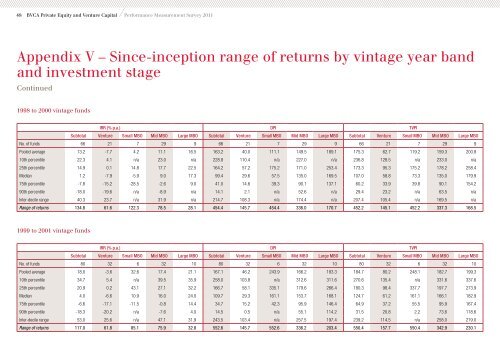
48 <strong>BVCA</strong> <strong>Private</strong> <strong>Equity</strong> <strong>and</strong> <strong>Venture</strong> <strong>Capital</strong> Performance Measurement Survey 2011<br />
Appendix V – Since-inception range of returns by vintage year b<strong>and</strong><br />
<strong>and</strong> investment stage<br />
Continued<br />
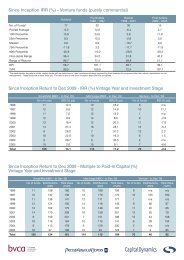
1998 to 2000 vintage funds<br />
IRR (% p.a.) DPI TVPI<br />
Subtotal <strong>Venture</strong> Small MBO Mid MBO Large MBO Subtotal <strong>Venture</strong> Small MBO Mid MBO Large MBO Subtotal <strong>Venture</strong> Small MBO Mid MBO Large MBO<br />
No. of funds 66 21 7 29 9 66 21 7 29 9 66 21 7 29 9<br />
Pooled average 13.2 -7.7 4.2 11.1 16.5 163.2 40.0 111.1 149.5 189.1 175.3 62.7 119.2 159.3 200.8<br />
10th percentile 22.3 4.1 n/a 23.0 n/a 228.8 110.4 n/a 227.0 n/a 236.8 128.5 n/a 233.0 n/a<br />
25th percentile 14.9 0.1 14.8 17.7 22.5 164.2 57.2 175.2 171.0 253.4 173.3 95.3 175.2 178.2 258.4<br />
Median 1.2 -7.9 -5.9 9.0 17.3 99.4 29.6 57.5 135.0 169.5 107.0 58.8 73.3 135.0 179.9<br />
75th percentile -7.8 -15.2 -28.5 -2.6 9.0 41.0 14.6 39.3 90.1 137.1 60.2 33.9 39.8 90.1 154.2<br />
90th percentile -18.0 -19.6 n/a -8.9 n/a 14.1 2.1 n/a 52.6 n/a 29.4 23.2 n/a 63.5 n/a<br />
Inter-decile range 40.3 23.7 n/a 31.9 n/a 214.7 108.3 n/a 174.4 n/a 207.4 105.4 n/a 169.5 n/a<br />
Range of returns 134.8 61.6 122.3 78.5 28.1 454.4 145.7 454.4 336.0 170.7 452.2 145.1 452.2 337.3 168.5<br />
1999 to 2001 vintage funds<br />
IRR (% p.a.) DPI TVPI<br />
Subtotal <strong>Venture</strong> Small MBO Mid MBO Large MBO Subtotal <strong>Venture</strong> Small MBO Mid MBO Large MBO Subtotal <strong>Venture</strong> Small MBO Mid MBO Large MBO<br />
No. of funds 80 32 6 32 10 80 32 6 32 10 80 32 6 32 10<br />
Pooled average 18.0 -3.6 32.6 17.4 21.1 167.1 46.2 243.9 166.2 183.3 184.7 80.2 248.1 182.7 199.3<br />
10th percentile 34.7 5.4 n/a 39.5 35.9 258.0 103.8 n/a 312.6 311.6 270.6 135.4 n/a 331.6 337.6<br />
25th percentile 20.9 0.2 43.1 27.1 32.2 166.7 58.1 335.1 179.6 266.4 180.3 98.4 337.7 197.7 273.9<br />
Median 4.0 -6.6 10.9 16.0 24.0 109.7 29.3 161.1 153.7 168.1 124.7 61.2 161.1 166.1 182.9<br />
75th percentile -6.6 -17.1 -11.5 -0.8 14.4 34.7 15.2 42.3 95.9 146.4 64.9 37.2 55.5 95.9 167.4<br />
90th percentile -18.3 -20.2 n/a -7.6 4.0 14.5 0.5 n/a 55.1 114.2 31.5 20.8 2.2 73.6 118.6<br />
Inter-decile range 53.0 25.6 n/a 47.1 31.9 243.5 103.4 n/a 257.5 197.4 239.2 114.5 n/a 258.0 219.0<br />
Range of returns 117.0 61.8 85.1 75.9 32.8 552.6 145.7 552.6 336.2 203.4 550.4 157.7 550.4 342.9 230.1