BVCA Private Equity and Venture Capital ... - BVCA admin
BVCA Private Equity and Venture Capital ... - BVCA admin
BVCA Private Equity and Venture Capital ... - BVCA admin

Create successful ePaper yourself
Turn your PDF publications into a flip-book with our unique Google optimized e-Paper software.
<strong>BVCA</strong> <strong>Private</strong> <strong>Equity</strong> <strong>and</strong> <strong>Venture</strong> <strong>Capital</strong> Performance Measurement Survey 2011 37<br />
Appendix III – Principal comparators <strong>and</strong> asset class overview<br />
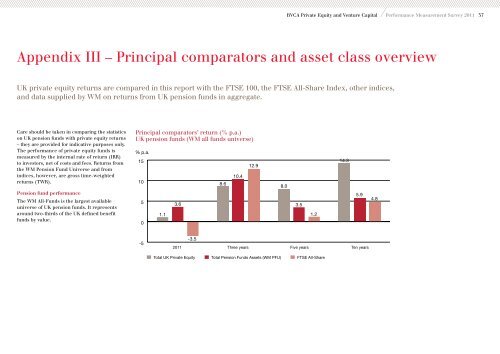
UK private equity returns are compared in this report with the FTSE 100, the FTSE All-Share Index, other indices,<br />
<strong>and</strong> data supplied by WM on returns from UK pension funds in aggregate.<br />
Care should be taken in comparing the statistics<br />
on UK pension funds with private equity returns<br />
– they are provided for indicative purposes only.<br />
The performance of private equity funds is<br />
measured by the internal rate of return (IRR)<br />
to investors, net of costs <strong>and</strong> fees. Returns from<br />
the WM Pension Fund Universe <strong>and</strong> from<br />
indices, however, are gross time-weighted<br />
returns (TWR).<br />
Pension fund performance<br />
The WM All-Funds is the largest available<br />
universe of UK pension funds. It represents<br />
around two-thirds of the UK defined benefit<br />
funds by value.<br />
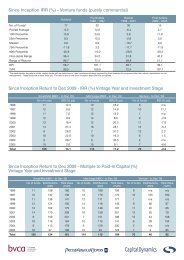
Principal comparators’ return (% p.a.)<br />
UK pension funds (WM all funds universe)<br />
% p.a.<br />
15<br />
10<br />
5<br />
0<br />
-5<br />
1.1<br />
3.6<br />
2011<br />
-3.5<br />
8.6<br />
10.4<br />
12.9<br />
Three years Five years Ten years<br />
Total UK <strong>Private</strong> <strong>Equity</strong> Total Pension Funds Assets (WM PFU) FTSE All-Share<br />
8.0<br />
3.5<br />
1.2<br />
14.3<br />
5.9<br />
4.8