BVCA Private Equity and Venture Capital ... - BVCA admin
BVCA Private Equity and Venture Capital ... - BVCA admin
BVCA Private Equity and Venture Capital ... - BVCA admin

You also want an ePaper? Increase the reach of your titles
YUMPU automatically turns print PDFs into web optimized ePapers that Google loves.
38 <strong>BVCA</strong> <strong>Private</strong> <strong>Equity</strong> <strong>and</strong> <strong>Venture</strong> <strong>Capital</strong> Performance Measurement Survey 2011<br />
Appendix III – Principal comparators <strong>and</strong> asset class overview<br />
Continued<br />
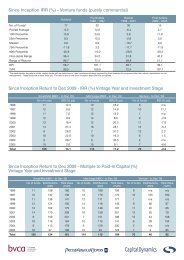
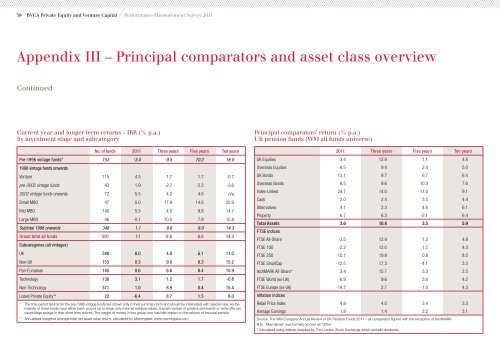
Current year <strong>and</strong> longer term returns – IRR (% p.a.)<br />
by investment stage <strong>and</strong> subcategory<br />
No. of funds 2011 Three years Five years Ten years<br />
Pre-1996 vintage funds* 153 -3.4 -0.5 70.2 16.0<br />
1996 vintage funds onwards<br />
<strong>Venture</strong> 115 4.5 1.7 1.7 -0.7<br />
pre-2002 vintage funds 43 1.9 -2.7 -2.3 -3.6<br />
2002 vintage funds onwards 72 5.5 4.2 4.6 n/a<br />
Small MBO 47 0.0 17.9 14.8 20.9<br />
Mid MBO 140 5.5 4.5 9.8 14.7<br />
Large MBO 46 -0.1 10.0 7.9 15.8<br />
Subtotal 1996 onwards 348 1.1 8.6 8.0 14.3<br />
Gr<strong>and</strong> total all funds<br />
Subcategories (all vintages)<br />
501 1.1 8.6 8.0 14.3<br />
UK 348 8.0 4.8 6.1 11.0<br />
Non-UK 153 0.3 9.0 8.3 15.2<br />
Pan-European 145 0.6 8.6 8.4 15.9<br />
Technology 130 3.1 1.2 1.7 -0.8<br />
Non-Technology 371 1.0 8.9 8.4 15.4<br />
Listed <strong>Private</strong> <strong>Equity</strong>** 22 -6.4 8.7 1.5 6.0<br />
* The time period returns for the pre-1996 vintage funds are shown only in their summary form <strong>and</strong> should be interpreted with special care. As the<br />
majority of these funds have either been wound up or retain only minimal residual values, a small number of positive exit events or write-offs can<br />
cause large swings in their short term returns. The weight of money in this group now has little impact on the returns of the total sample.<br />
** Annualised weighted average total net asset value return, calculated by Morningstar, www.morningstar.com<br />
Principal comparators’ return (% p.a.)<br />
UK pension funds (WM all funds universe)<br />
2011 Three years Five years Ten years<br />
UK Equities -3.4 12.9 1.1 4.8<br />
Overseas Equities -8.5 9.4 2.4 5.0<br />
UK Bonds 13.1 9.7 6.7 6.4<br />
Overseas Bonds 8.5 9.6 10.3 7.6<br />
Index-Linked 24.7 14.0 11.0 9.1<br />
Cash 2.0 2.4 3.5 4.4<br />
Alternatives 4.1 2.3 4.6 6.1<br />
Property 6.7 6.3 -2.1 6.4<br />
Total Assets<br />
FTSE indices<br />
3.6 10.4 3.5 5.9<br />
FTSE All-Share -3.5 12.9 1.2 4.8<br />
FTSE 100 -2.2 12.0 1.5 4.3<br />
FTSE 250 -10.1 19.9 0.8 8.5<br />
FTSE SmallCap -12.5 17.3 -4.1 3.3<br />
techMARK All-Share* 3.4 15.7 5.3 2.5<br />
FTSE World (ex-UK) -6.9 9.6 3.6 4.2<br />
FTSE Europe (ex-UK)<br />
Inflation indices<br />
-14.7 2.7 -1.0 4.3<br />
Retail Price Index 4.8 4.0 3.4 3.3<br />
Average Earnings 1.8 1.4 2.2 3.1<br />
Source: The WM Company Annual Review of UK Pension Funds 2011 – all comparator figures with the exception of techMARK.<br />
N.B. ‘Alternatives’ was formerly known as ‘Other’.<br />
* Calculated using indices supplied by The London Stock Exchange which exclude dividends.