Downloaded from bmj.com on 28 February 2008
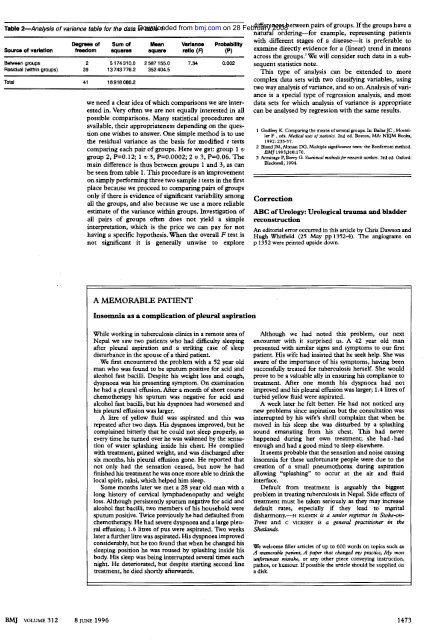
i . ~~ " . It ~, I ; Statistics <strong>Notes</strong> ' ..,' ,I ., ;; , f , , , ;~ Measurement error ,.,; r,i 1; '} 1 J Martin <strong>Bland</strong>, Douglas G Altman I , ,\ j ;\ This is the 21st in a series of Several measurements of the same quantity on the same .' ij occasional notes on medical subject will not in general be the same. This may be Table 1-Repeated peak ex~/ratory flow rate (PEFR) I f measurements for 20 schoolchildren .. " stansncs. because of natural vananon m the subject, vananon m ' ;) ~ shows the measurement four measurements process, of or lung both. function For example, in each table of 20 1 Child PEFR (V mln .) 1: schoolchildren (taken from a larger study'). The first No 1st 2nd 3rd 4th Mean SO I child shows typical variation, having peak expiratory ! flow rates of 190, 220, 200, and 200 l/min. 1 190 220 200 200 202.50 12.58 ) ;I' Let us suppose that the child has a "true" average 2 220 200 240 230 222.50 17.08 ! ...3 260 260 240 280 260.00 16.33 ,Ii value over all possIble measurements, which IS what we 4 210 300 280 265 263.75 38.60 \' really want to know when we make a measurement. 5 270 265 280 270 271.25 6.29 '" Repeated measurements on the same subject will vary 6 280 280 270 275 276.25 4.79 j: around the true value because of measurement error. 7 260 280 280 300 280.00 16.33 i Th ..8 275 275 275 305 282.50 15 00 , e standard. deVlanon of repeated measure~ents on 9 280 290 300 290 290.00 8:16 the same subject enables us to measure the sIZe of the 10 320 290 300 290 300.00 14.14 measurement error. We shall assume that this standard 11 300 300 310 300 302.50 5.00 deviation is the same for all subjects, as otherwise there 12 270 250 330 370 305.00 55.08 , would be no point in estimating it. The main exception 13 320 330 330 330 327.50 5.00 . h .14 335 320 335 375 341.25 2358 IS W en the me~surement en:or depends on the sIZe of 15 350 320 340 355 343.75 18:87 the measurement, usually WIth measurements be com- 16 360 320 350 345 343.75 17.02 ing more variable as the magnitude of the measurement 17 330 340 380 390 360.00 29.44 f 60 increases. We deal with this case in a subsequent statis- 18 335 385 360 370 362.50 21.02 ~ ° tics note. The common standard deviation of repeated 19 400 420 425 420 416.25 11.09 c 20 430 460 480 470 460.00 21.60 .g measurements IS known as the unthtn-subject standard .~ 40 ° deviation, which we shall denote <strong>by</strong> ~ =P: To estimate the within-subject standard deviation, we i 20 : .° need several subjects with at least two measurements for standard deviation ~w is given <strong>by</strong> when n is the number 'j ~ 0 0 0 ° each. In addition to the data, table 1 also shows the of subjects. We can check for a relation between stand- ' .i 0.00 ° mean and standard deviation of the four readings for ard deviation and mean <strong>by</strong> plotting for each subject the ~ goo 300 400 500 each child. To get the common within-subject standard absolute value of the difference--that is, ignoring any Subject mean (I/min) deviation we actually average the variances, the squares FI 1 I d.. d I b. t .of the standard deviations. The mean within-subject standard 9 -n deviations IVI ua su plotted !/ec s vanance IS 460.52, so the esumated within-subject sign-against the mean. The measurement error can be quoted as ~. The UliLerence ,... b etween a su b., ject s measurement and the against their means standard deviation is ~w= f46o:5 = 21.5 1/min. The true value would be expected to be less than 1. 96 ~w for calculation is easier using a program that performs one 95% of observations. Another useful way of presenting way analysis ofvariance2 (table 2). The value called the measurement error is sometimes called the repeatability, residual mean square is the within-subject variance. which is J2 x 1. 96 ~ or 2. 77~. The difference The analysis of variance method is the better approach between two measurements for the same subject is in practice, as it deals automatically with the case of expected to be less than 2. 77 ~w for 95% of pairs of subjects having different numbers of observations. We observations. For the data in table 1 the repeatability is should check the assumption that the standard 2.77 x 2.5 = 60 l/min. The large variability in peak deviation is unrelated to the magnitude of the expiratory flow rate is well known, so individual measurement. This can be done graphically, <strong>by</strong> plotting readings of peak expiratory flow are seldom used. the individual subject's standard deviations against their The variable used for analysis in the study from which means (see fig 1). Any important relation should be table 1 was taken was the mean of the last three fairly obvious, but we can check analytically <strong>by</strong> calculat- readings.' .ing a rank correlation coefficient. For the figure there Other ways of describing the repeatability of HDePalartm~nt of Public S e G th ScIences, ' H .tal t eorge s OSpl Medical School London does not appear to be a relation (Kendall's t = 0.16, P - 0 3) -..stansncs A common design is to take only two measurements measurements .. notes. will be considered in subsequent SW17 ORE' per subject. In ~s case the method can be simplified I <strong>Bland</strong> <strong>JM</strong>, Holland WW, Elliott A. The development of respiratory J Martin <strong>Bland</strong>, professor of because the vanance of two observations is half the symptoms in a cohort of Kent schoolchild~o. Bu/J Physio-~rh Resp medical statistics IRCF Medical Statistics Group, Centre for Statistics in Medicine, square of their difference. So if the difference between th b ..'. ...2 e two 0 servanons for subject I IS di the WIthin-subject 1974;10:699-716. Altman DG, <strong>Bland</strong> <strong>JM</strong>. Comparing several groups using analysis of variance. BM] 1996;312:1472. . Institute of Health Table 2-0ne way analysis of variance for the data of table 1 Sciences, PO Box 777, Oxford OX3 7LF 0 egrees 0 f Variance .. ratio Probability Douglas G Altman, head Source of variation freedom Sum of squares Mean square (F) (P) Correspondence to: Children 19 285318.44 15016.78 32.6