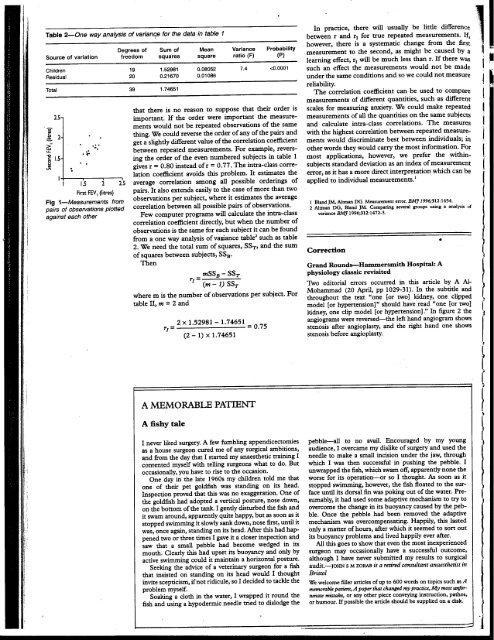
" "'.~..~~ ~.v~. a"uu,vu,-~ o'V'-" 'v UCla. u.C VL"~llL'" o.;VI1o.;urr~I11; complete destruction of the femoral head. Blood cultures infection. If the diagnosis is missed or delayed, the con- grew S auTeUS. His C reactive protein peaked at 122 sequences are serious: the joint destruction may mg/!. The hip was drained surgically of large amounts of preclude successful arthroplasty or, perhaps worse, a pus, culture of which grew S aureus and Proteus mirabi- hip replacement may be inserted into an unrecognised lis. He ~as treated with a prolonged course of high dose septic environment. antibiotics, with some clinical improvement but The most userJl non-specific tests seem to be the continuing poor mobility. erythrocyte sedimentation rate and measurement of C . n an ..~e~ctive ?ro~ein; the single most useful specific test is ~ Her DIscussion Jomt asplranon and culture. . first These patients were all elderly and had pre-existing We recommend consideration of septic arthritis in ng/l. osteoarthritis and concurrent infection elsewhere. any patient with an apparently acute exacerbation of an pus None, however, had other systemic conditions predis- osteoarthritic joint, particularly if there is a possibility of nar'y posing to infection, such as diabetes, except for the sec- coexistent infection elsewhere. Other possible nonayed ond patient, who had a myeloproliferative disorder. The infective causes of a rapid deterioration in symptoms ,ated development of septic arthritis <strong>by</strong> haematogenous include pseudogout and avascular necrosis, and these was spread was associated with increasing hip pain and will also need to be considered. : she rapid destruction of the femoral head. This was accom- Funding: None. 1 few panied <strong>by</strong> a delay in diagnosis of up to six months. Infection in the presence of existing inflammatory Conflict ofinterest:None. ldio- joint disease, particularly rheumatoid arthritis, is well mtis known,' It is much rarer to see this in association with I Gardner GC, Weisman MH. Pyarthrosis in patients with rhewnatoid ISIng the much commoner osteoarthrins, although It IS arthritis, 40 years. a Am<strong>JM</strong>ed report of 1990;88:503-11. 13 cases and a review of the literature from the past ttage mm recognised! In common with other bone and joint . m fi ectlOnS, . th e presentanon . 0 f sepnc . ar thr InS " has 2 Goldenberg DL, Cohen AS. Acute infectious arthritis. Am J Med 3 Vincent 1976;60:369-77. GM, Amirault )D. Septic arthritis in the elderly. Chn Orthop )fhis with changed in recent years from the usual florid illness. 1991;251:241-5. leral atec- :rred . Statistics <strong>Notes</strong> .. Measurement error and correlation coefficients J Martin <strong>Bland</strong>, Douglas G Altman This is the 22nd in a series of Measurement error is the variation between measure- natural approach when investigating measurement error, occasional notes on medical ments of the same quantity on the same individual.! To this will inflate the correlation coefficient, statistics quantify measurement error we need repeated measure- The correlation coefficient between repeated measments on several subjects. We have discussed the urements is often called the reliability of the f within-subject standard deviation as an index of measurement method, It is widely used in the validation ~ measurement error,! which we like as it has a simple of psychological measures such as scales of anxiety and ( CliniCal interpretation. Here we consider the use of cor- depression, where it is known as the test-retest reliabilrelation coefficients to quantify measurement error, ity,ln such studies it is quoted for different populations 1 A common design for the investigation of measurement (university students, psychiatric outpatients, etc) ;teo- " error is to take pairs of measurements on a group of sub- because the correlation coefficient differs between them ' . I jects, as in table 1. When we have pairs of observations it is as a result of differing ranges of the quantity being natural to plot one measurement against the other, The measured, The user has to select the correlation from resulting scatter diagram (see figure 1) may tempt us to the study population most like the user's own. Departm~nt of Public Healtb Sciences, S t G ~orge ' s H osp i t al calculate a correlation coefficient between the first and second measurement. There are difficulties in interpreting thi 1 . ffi . In al th 1 . between s corre repeated anon coe measurements Clent. gener, will depend e corre on anon the Another problem with the use of the correlation coefficient between the first and second measurements is Table 1-Pairs of measurements of FEV 1 (Htres) a few Medical School, London variability between sub'ects. Samples containing subjects weeks apart from 20 Scottish schoolchildren, .tak~n from SW17 ORE J Martin <strong>Bland</strong>, professor of h W 0 A,a- tl UL1Ler grea y will J . pro duce 1arger corre 1 anon .a larger study (0 Strachan, personal communication) medical statistics coefficients than will samples containing similar subjects' ICRF M d 1 S ., e lca tatlstlcs For example, suppose we split ...easuremen this group m whom we have measured forced expiratory volume m one second (FEV J S b. u Jec I No M 1 sl I 2nd S u b. No Jec Measuremen I 1 sl 2nd Group, Centre for into two subsamples, the first 10 subjects and the second Statistics in Medicine, 10 subjects. As table 1 is ordered <strong>by</strong> the first FEV I 1 1.19 1.37 11 1.54 1.57 In~titute ofHealtb measurement, both subsamples vary less than does the 2 1.33 1.32 12 1.59 1.60 ScIences, PO Box 777, Oxford OX3 7LF whole sample. Th e corre 1 . anon fi or th firs e b t su samp 1 .3 e IS 4 1.35 1.36 1.40 1.25 13 14 1.61 1.61 1.53 1.61 DougiasGAInnanhead r=0.63andfortheseconditisr=0.31,bothlessthan 5 1.36 1.29 15 1.62 1.68 , r= 0.77 for the full sample. The correlation coefficient 6 1.38 1.37 16 1.78 1.76 Correspondence to: thus depends on the way the sample is chosen, and it has 7 1.38 1.40 17 1.80 1.82 Professor <strong>Bland</strong>. meaning only for the population from which the stUdY: ~::~ ~:~:~: ~:: ~:~~ l subjects can be regarded as a random sample. If we select 10 1.431.51 20 2.102.20 l EMJ 1996;313:41-2 subjects to give a wide range of the measurement, the Ii 8M] VOLUME313 6 JULy 1996 41 H I i I i
.'.)'. In practice, there will usually be little difference"; 11 Table 2-0ne way analysis of varianqe for the data in table 1 between r and rI for true repeated measurements. If, Source of variation Degrees of freedom Sum of squares Mean square Variance ratio (F) Probability (P) however, there is a systematic change from the first d .gh b db! measurement to the secon , as ml t e cause y a learning effect, rl will be much less than r. If there was "- '; !' ... . Children 19 1.52981 0.08052 7.4