BMJ Statistical Notes Series List by JM Bland: http://www-users.york ...
BMJ Statistical Notes Series List by JM Bland: http://www-users.york ...
BMJ Statistical Notes Series List by JM Bland: http://www-users.york ...

Create successful ePaper yourself
Turn your PDF publications into a flip-book with our unique Google optimized e-Paper software.
Education and debate<br />
Department of<br />
Public Health<br />
Sciences,<br />
St George’s<br />
Hospital Medical<br />
School, London<br />
SW17 0RE<br />
J Martin <strong>Bland</strong><br />
professor of medical<br />
statistics<br />
ICRF Medical<br />
Statistics Group,<br />
Centre for Statistics<br />
in Medicine,<br />
Institute of Health<br />
Sciences, Oxford<br />
OX3 7LF<br />
Douglas G Altman<br />
professor of statistics<br />
in medicine<br />
Correspondence to:<br />
Professor <strong>Bland</strong><br />
<strong>BMJ</strong> 2000;320:1468<br />
Statistics <strong>Notes</strong><br />
The odds ratio<br />
Downloaded from<br />
bmj.com on 28 February 2008<br />
J Martin <strong>Bland</strong>, Douglas G Altman<br />
In recent years odds ratios have become widely used in<br />
medical reports—almost certainly some will appear in<br />
today’s <strong>BMJ</strong>. There are three reasons for this. Firstly,<br />
they provide an estimate (with confidence interval) for<br />
the relationship between two binary (“yes or no”) variables.<br />
Secondly, they enable us to examine the effects of<br />
other variables on that relationship, using logistic<br />
regression. Thirdly, they have a special and very<br />
convenient interpretation in case-control studies (dealt<br />
with in a future note).<br />
The odds are a way of representing probability,<br />
especially familiar for betting. For example, the odds<br />
that a single throw of a die will produce a six are 1 to<br />
5, or 1/5. The odds is the ratio of the probability that<br />
the event of interest occurs to the probability that it<br />
does not. This is often estimated <strong>by</strong> the ratio of the<br />
number of times that the event of interest occurs to<br />
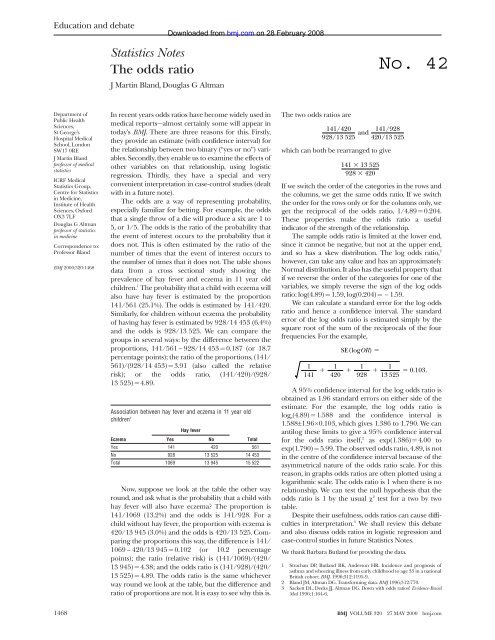
the number of times that it does not. The table shows<br />
data from a cross sectional study showing the<br />
prevalence of hay fever and eczema in 11 year old<br />
children. 1 The probability that a child with eczema will<br />
also have hay fever is estimated <strong>by</strong> the proportion<br />
141/561 (25.1%). The odds is estimated <strong>by</strong> 141/420.<br />
Similarly, for children without eczema the probability<br />
of having hay fever is estimated <strong>by</strong> 928/14 453 (6.4%)<br />
and the odds is 928/13 525. We can compare the<br />
groups in several ways: <strong>by</strong> the difference between the<br />
proportions, 141/561 − 928/14 453 = 0.187 (or 18.7<br />
percentage points); the ratio of the proportions, (141/<br />
561)/(928/14 453) = 3.91 (also called the relative<br />
risk); or the odds ratio, (141/420)/(928/<br />
13 525) = 4.89.<br />
Association between hay fever and eczema in 11 year old<br />
children 1<br />
Hay fever<br />
Eczema<br />
Yes No<br />
Total<br />
Yes 141 420 561<br />
No 928 13 525 14 453<br />
Total 1069 13 945 15 522<br />
Now, suppose we look at the table the other way<br />
round, and ask what is the probability that a child with<br />
hay fever will also have eczema? The proportion is<br />
141/1069 (13.2%) and the odds is 141/928. For a<br />
child without hay fever, the proportion with eczema is<br />
420/13 945 (3.0%) and the odds is 420/13 525. Comparing<br />
the proportions this way, the difference is 141/<br />
1069 − 420/13 945 = 0.102 (or 10.2 percentage<br />
points); the ratio (relative risk) is (141/1069)/(420/<br />
13 945) = 4.38; and the odds ratio is (141/928)/(420/<br />
13 525) = 4.89. The odds ratio is the same whichever<br />
way round we look at the table, but the difference and<br />
ratio of proportions are not. It is easy to see why this is.<br />
The two odds ratios are<br />
which can both be rearranged to give<br />
If we switch the order of the categories in the rows and<br />
the columns, we get the same odds ratio. If we switch<br />
the order for the rows only or for the columns only, we<br />
get the reciprocal of the odds ratio, 1/4.89 = 0.204.<br />
These properties make the odds ratio a useful<br />
indicator of the strength of the relationship.<br />
The sample odds ratio is limited at the lower end,<br />
since it cannot be negative, but not at the upper end,<br />
and so has a skew distribution. The log odds ratio, 2<br />
however, can take any value and has an approximately<br />
Normal distribution. It also has the useful property that<br />
if we reverse the order of the categories for one of the<br />
variables, we simply reverse the sign of the log odds<br />
ratio: log(4.89) = 1.59, log(0.204) = − 1.59.<br />
We can calculate a standard error for the log odds<br />
ratio and hence a confidence interval. The standard<br />
error of the log odds ratio is estimated simply <strong>by</strong> the<br />
square root of the sum of the reciprocals of the four<br />
frequencies. For the example,<br />
A 95% confidence interval for the log odds ratio is<br />
obtained as 1.96 standard errors on either side of the<br />
estimate. For the example, the log odds ratio is<br />
log e(4.89) = 1.588 and the confidence interval is<br />
1.588±1.96×0.103, which gives 1.386 to 1.790. We can<br />
antilog these limits to give a 95% confidence interval<br />
for the odds ratio itself, 2 as exp(1.386) = 4.00 to<br />
exp(1.790) = 5.99. The observed odds ratio, 4.89, is not<br />
in the centre of the confidence interval because of the<br />
asymmetrical nature of the odds ratio scale. For this<br />
reason, in graphs odds ratios are often plotted using a<br />
logarithmic scale. The odds ratio is 1 when there is no<br />
relationship. We can test the null hypothesis that the<br />
odds ratio is 1 <strong>by</strong> the usual 2 test for a two <strong>by</strong> two<br />
table.<br />
Despite their usefulness, odds ratios can cause difficulties<br />
in interpretation. 3 We shall review this debate<br />
and also discuss odds ratios in logistic regression and<br />
case-control studies in future Statistics <strong>Notes</strong>.<br />
We thank Barbara Butland for providing the data.<br />
1 Strachan DP, Butland BK, Anderson HR. Incidence and prognosis of<br />
asthma and wheezing illness from early childhood to age 33 in a national<br />
British cohort. <strong>BMJ</strong>. 1996;312:1195-9.<br />
2 <strong>Bland</strong> <strong>JM</strong>, Altman DG. Transforming data. <strong>BMJ</strong> 1996;312:770.<br />
3 Sackett DL, Deeks JJ, Altman DG. Down with odds ratios! Evidence-Based<br />
Med 1996;1:164-6.<br />
1468 <strong>BMJ</strong> VOLUME 320 27 MAY 2000 bmj.com