BMJ Statistical Notes Series List by JM Bland: http://www-users.york ...
BMJ Statistical Notes Series List by JM Bland: http://www-users.york ...
BMJ Statistical Notes Series List by JM Bland: http://www-users.york ...

You also want an ePaper? Increase the reach of your titles
YUMPU automatically turns print PDFs into web optimized ePapers that Google loves.
15 Van den Hoogen H<strong>JM</strong>, Koes BW, van Eijk JT, Bouter LM, Devillé W. On<br />
the course of low back pain in general practice: a one year follow up<br />
study. Ann Rheum Dis 1998;57:13-9.<br />
16 Croft PR, Papageorgiou AC, Ferry S, Thomas E, Jayson MIV, Silman AJ.<br />
Psychological distress and low back pain: Evidence from a prospective<br />
study in the general population. Spine 1996;20:2731-7.<br />
17 Papageorgiou AC, Macfarlane GJ, Thomas E, Croft PR, Jayson MIV,<br />
Silman AJ. Psychosocial factors in the work place—do they predict new<br />
episodes of low back pain? Spine 1997;22:1137-42.<br />
18 Main CJ, Wood PL, Hollis S, Spanswick CC, Waddell G. The distress and<br />
risk assessment method. A simple patient classification to identify distress<br />
and evaluate the risk of poor outcome. Spine 1992;17:42-52.<br />
19 Coste J, Delecoeuillerie G, Cohen de Lara A, Le Parc <strong>JM</strong>, Paolaggi JB.<br />
Clinical course and prognostic factors in acute low back pain: an inception<br />
cohort study in primary care practice. <strong>BMJ</strong> 1994;308:577-80.<br />
Statistics notes<br />
Variables and parameters<br />
Douglas G Altman, J Martin <strong>Bland</strong><br />
Like all specialist areas, statistics has developed its own<br />
language. As we have noted before, 1 much confusion<br />
may arise when a word in common use is also given a<br />
technical meaning. Statistics abounds in such terms,<br />
including normal, random, variance, significant, etc.<br />
Two commonly confused terms are variable and<br />
parameter; here we explain and contrast them.<br />
Information recorded about a sample of individuals<br />
(often patients) comprises measurements such as<br />
blood pressure, age, or weight and attributes such as<br />
blood group, stage of disease, and diabetes. Values of<br />
these will vary among the subjects; in this context<br />
blood pressure, weight, blood group and so on are<br />
variables. Variables are quantities which vary from<br />
individual to individual.<br />
By contrast, parameters do not relate to actual<br />
measurements or attributes but to quantities defining a<br />
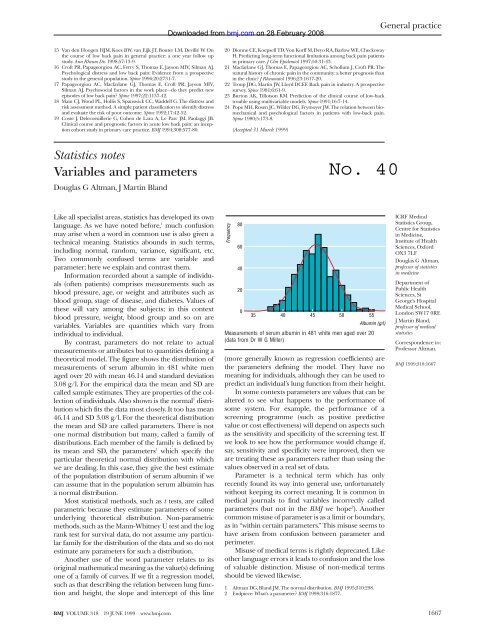
theoretical model. The figure shows the distribution of<br />
measurements of serum albumin in 481 white men<br />
aged over 20 with mean 46.14 and standard deviation<br />
3.08 g/l. For the empirical data the mean and SD are<br />
called sample estimates. They are properties of the collection<br />
of individuals. Also shown is the normal 1 distribution<br />
which fits the data most closely. It too has mean<br />
46.14 and SD 3.08 g/l. For the theoretical distribution<br />
the mean and SD are called parameters. There is not<br />
one normal distribution but many, called a family of<br />
distributions. Each member of the family is defined <strong>by</strong><br />
its mean and SD, the parameters 1 which specify the<br />
particular theoretical normal distribution with which<br />
we are dealing. In this case, they give the best estimate<br />
of the population distribution of serum albumin if we<br />
can assume that in the population serum albumin has<br />
a normal distribution.<br />
Most statistical methods, such as t tests, are called<br />
parametric because they estimate parameters of some<br />
underlying theoretical distribution. Non-parametric<br />
methods, such as the Mann-Whitney U test and the log<br />
rank test for survival data, do not assume any particular<br />
family for the distribution of the data and so do not<br />
estimate any parameters for such a distribution.<br />
Another use of the word parameter relates to its<br />
original mathematical meaning as the value(s) defining<br />
one of a family of curves. If we fit a regression model,<br />
such as that describing the relation between lung function<br />
and height, the slope and intercept of this line<br />
<strong>BMJ</strong> VOLUME 318 19 JUNE 1999 <strong>www</strong>.bmj.com<br />
Downloaded from<br />
bmj.com on 28 February 2008<br />
20 Dionne CE, Koepsell TD, Von Korff M, Deyo RA, Barlow WE, Checkoway<br />
H. Predicting long-term functional limitations among back pain patients<br />
in primary care. J Clin Epidemiol 1997;50:31-43.<br />
21 Macfarlane GJ, Thomas E, Papageorgiou AC, Schollum J, Croft PR. The<br />
natural history of chronic pain in the community: a better prognosis than<br />
in the clinic? J Rheumatol 1996;23:1617-20.<br />
22 Troup JDG, Martin JW, Lloyd DCEF. Back pain in industry. A prospective<br />
survey. Spine 1981;6:61-9.<br />
23 Burton AK, Tillotson KM. Prediction of the clinical course of low-back<br />
trouble using multivariable models. Spine 1991;16:7-14.<br />
24 Pope MH, Rosen JC, Wilder DG, Frymoyer JW. The relation between biomechanical<br />
and psychological factors in patients with low-back pain.<br />
Spine 1980;5:173-8.<br />
Frequency<br />
(Accepted 31 March 1999)<br />
80<br />
60<br />
40<br />
20<br />
0<br />
35 40 45 50 55<br />
Albumin (g/l)<br />
Measurements of serum albumin in 481 white men aged over 20<br />
(data from Dr W G Miller)<br />
(more generally known as regression coefficients) are<br />
the parameters defining the model. They have no<br />
meaning for individuals, although they can be used to<br />
predict an individual’s lung function from their height.<br />
In some contexts parameters are values that can be<br />
altered to see what happens to the performance of<br />
some system. For example, the performance of a<br />
screening programme (such as positive predictive<br />
value or cost effectiveness) will depend on aspects such<br />
as the sensitivity and specificity of the screening test. If<br />
we look to see how the performance would change if,<br />
say, sensitivity and specificity were improved, then we<br />
are treating these as parameters rather than using the<br />
values observed in a real set of data.<br />
Parameter is a technical term which has only<br />
recently found its way into general use, unfortunately<br />
without keeping its correct meaning. It is common in<br />
medical journals to find variables incorrectly called<br />
parameters (but not in the <strong>BMJ</strong> we hope 2 ). Another<br />
common misuse of parameter is as a limit or boundary,<br />
as in “within certain parameters.” This misuse seems to<br />
have arisen from confusion between parameter and<br />
perimeter.<br />
Misuse of medical terms is rightly deprecated. Like<br />
other language errors it leads to confusion and the loss<br />
of valuable distinction. Misuse of non-medical terms<br />
should be viewed likewise.<br />
1 Altman DG, <strong>Bland</strong> <strong>JM</strong>. The normal distribution. <strong>BMJ</strong> 1995;310:298.<br />
2 Endpiece: What’s a parameter? <strong>BMJ</strong> 1998;316:1877.<br />
General practice<br />
ICRF Medical<br />
Statistics Group,<br />
Centre for Statistics<br />
in Medicine,<br />
Institute of Health<br />
Sciences, Oxford<br />
OX3 7LF<br />
Douglas G Altman,<br />
professor of statistics<br />
in medicine<br />
Department of<br />
Public Health<br />
Sciences, St<br />
George’s Hospital<br />
Medical School,<br />
London SW17 0RE<br />
J Martin <strong>Bland</strong>,<br />
professor of medical<br />
statistics<br />
Correspondence to:<br />
Professor Altman.<br />
<strong>BMJ</strong> 1999;318:1667<br />
1667