BMJ Statistical Notes Series List by JM Bland: http://www-users.york ...
BMJ Statistical Notes Series List by JM Bland: http://www-users.york ...
BMJ Statistical Notes Series List by JM Bland: http://www-users.york ...

You also want an ePaper? Increase the reach of your titles
YUMPU automatically turns print PDFs into web optimized ePapers that Google loves.
i . ~~ " .<br />
It<br />
~,<br />
I<br />
; Statistics <strong>Notes</strong> ' ..,'<br />
,I .,<br />
;; , f<br />
,<br />
, , ;~ Measurement error<br />
,.,; r,i<br />
1; '}<br />
1 J Martin <strong>Bland</strong>, Douglas G Altman I<br />
, ,\<br />
j<br />
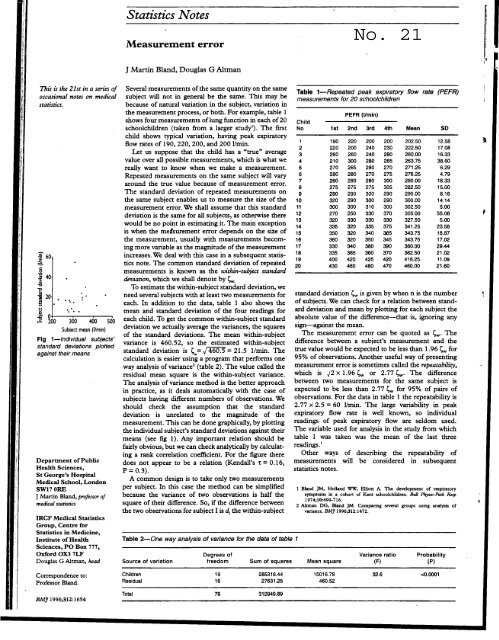
;\ This is the 21st in a series of Several measurements of the same quantity on the same .'<br />
ij occasional notes on medical subject will not in general be the same. This may be Table 1-Repeated peak ex~/ratory flow rate (PEFR) I<br />
f measurements for 20 schoolchildren ..<br />
" stansncs. because of natural vananon m the subject, vananon m '<br />
;) ~ shows the measurement four measurements process, of or lung both. function For example, in each table of 20 1 Child PEFR (V mln .)<br />
1: schoolchildren (taken from a larger study'). The first No 1st 2nd 3rd 4th Mean SO<br />
I child shows typical variation, having peak expiratory<br />
! flow rates of 190, 220, 200, and 200 l/min. 1 190 220 200 200 202.50 12.58 )<br />
;I' Let us suppose that the child has a "true" average 2 220 200 240 230 222.50 17.08<br />
! ...3 260 260 240 280 260.00 16.33<br />
,Ii value over all possIble measurements, which IS what we 4 210 300 280 265 263.75 38.60<br />
\' really want to know when we make a measurement. 5 270 265 280 270 271.25 6.29<br />
'" Repeated measurements on the same subject will vary 6 280 280 270 275 276.25 4.79<br />
j: around the true value because of measurement error. 7 260 280 280 300 280.00 16.33<br />
i Th ..8 275 275 275 305 282.50 15 00<br />
, e standard. deVlanon of repeated measure~ents on 9 280 290 300 290 290.00 8:16<br />
the same subject enables us to measure the sIZe of the 10 320 290 300 290 300.00 14.14<br />
measurement error. We shall assume that this standard 11 300 300 310 300 302.50 5.00<br />
deviation is the same for all subjects, as otherwise there 12 270 250 330 370 305.00 55.08 ,<br />
would be no point in estimating it. The main exception 13 320 330 330 330 327.50 5.00<br />
. h .14 335 320 335 375 341.25 2358<br />
IS W en the me~surement en:or depends on the sIZe of 15 350 320 340 355 343.75 18:87<br />
the measurement, usually WIth measurements be com- 16 360 320 350 345 343.75 17.02<br />
ing more variable as the magnitude of the measurement 17 330 340 380 390 360.00 29.44<br />
f 60 increases. We deal with this case in a subsequent statis- 18 335 385 360 370 362.50 21.02<br />
~ ° tics note. The common standard deviation of repeated 19 400 420 425 420 416.25 11.09<br />
c 20 430 460 480 470 460.00 21.60<br />
.g measurements IS known as the unthtn-subject standard<br />
.~ 40 ° deviation, which we shall denote <strong>by</strong> ~<br />
=P: To estimate the within-subject standard deviation, we<br />
i 20 : .° need several subjects with at least two measurements for standard deviation ~w is given <strong>by</strong> when n is the number 'j<br />
~ 0 0 0 ° each. In addition to the data, table 1 also shows the of subjects. We can check for a relation between stand- '<br />
.i 0.00 ° mean and standard deviation of the four readings for ard deviation and mean <strong>by</strong> plotting for each subject the<br />
~ goo 300 400 500 each child. To get the common within-subject standard absolute value of the difference--that is, ignoring any<br />
Subject mean (I/min) deviation we actually average the variances, the squares<br />
FI 1 I d.. d I b. t .of the standard deviations. The mean within-subject<br />
standard 9 -n deviations IVI ua su plotted !/ec s vanance IS 460.52, so the esumated within-subject<br />
sign-against the mean.<br />
The measurement error can be quoted as ~. The<br />
UliLerence ,... b<br />
etween a su<br />
b.,<br />
ject s measurement and the<br />
against their means standard deviation is ~w= f46o:5 = 21.5 1/min. The true value would be expected to be less than 1. 96 ~w for<br />
calculation is easier using a program that performs one 95% of observations. Another useful way of presenting<br />
way analysis ofvariance2 (table 2). The value called the measurement error is sometimes called the repeatability,<br />
residual mean square is the within-subject variance. which is J2 x 1. 96 ~ or 2. 77~. The difference<br />
The analysis of variance method is the better approach between two measurements for the same subject is<br />
in practice, as it deals automatically with the case of expected to be less than 2. 77 ~w for 95% of pairs of<br />
subjects having different numbers of observations. We observations. For the data in table 1 the repeatability is<br />
should check the assumption that the standard 2.77 x 2.5 = 60 l/min. The large variability in peak<br />
deviation is unrelated to the magnitude of the expiratory flow rate is well known, so individual<br />
measurement. This can be done graphically, <strong>by</strong> plotting readings of peak expiratory flow are seldom used.<br />
the individual subject's standard deviations against their The variable used for analysis in the study from which<br />
means (see fig 1). Any important relation should be table 1 was taken was the mean of the last three<br />
fairly obvious, but we can check analytically <strong>by</strong> calculat- readings.'<br />
.ing a rank correlation coefficient. For the figure there Other ways of describing the repeatability of<br />
HDePalartm~nt of Public<br />
S e G th ScIences, ' H .tal<br />
t eorge s OSpl<br />
Medical School London<br />
does not appear to be a relation (Kendall's t = 0.16,<br />
P - 0 3)<br />
-..stansncs<br />
A common design is to take only two measurements<br />
measurements<br />
..<br />
notes.<br />
will be considered in subsequent<br />
SW17 ORE' per subject. In ~s case the method can be simplified I <strong>Bland</strong> <strong>JM</strong>, Holland WW, Elliott A. The development of respiratory<br />
J Martin <strong>Bland</strong>, professor of because the vanance of two observations is half the symptoms in a cohort of Kent schoolchild~o. Bu/J Physio-~rh Resp<br />
medical statistics<br />
IRCF Medical Statistics<br />
Group, Centre for<br />
Statistics in Medicine,<br />
square of their difference. So if the difference between<br />
th b ..'. ...2<br />
e two 0 servanons for subject I IS di the WIthin-subject<br />
1974;10:699-716.<br />
Altman DG, <strong>Bland</strong> <strong>JM</strong>. Comparing several groups using analysis of<br />
variance. BM] 1996;312:1472.<br />
.<br />
Institute of Health Table 2-0ne way analysis of variance for the data of table 1<br />
Sciences, PO Box 777,<br />
Oxford OX3 7LF<br />
0 egrees 0 f Variance .. ratio Probability<br />
Douglas G Altman, head Source of variation freedom Sum of squares Mean square (F) (P)<br />
Correspondence to: Children 19 285318.44 15016.78 32.6