BMJ Statistical Notes Series List by JM Bland: http://www-users.york ...
BMJ Statistical Notes Series List by JM Bland: http://www-users.york ...
BMJ Statistical Notes Series List by JM Bland: http://www-users.york ...
Create successful ePaper yourself
Turn your PDF publications into a flip-book with our unique Google optimized e-Paper software.
RESEARCH METHODS AND<br />
REPORTING, p 682<br />
1 Centre for Statistics in Medicine,<br />
University of Oxford, Oxford<br />
OX2 6UD<br />
2 Department of Health Sciences,<br />
University of York, Heslington, York<br />
YO10 5DD<br />
Correspondence to: D G Altman<br />
doug.altman@csm.ox.ac.uk<br />
Cite this as: <strong>BMJ</strong> 2011;343:d2090<br />
doi: 10.1136/bmj.d2090<br />
RESEARCH METHODS<br />
& REPORTING<br />
STATISTICS NOTES<br />
How to obtain the confidence interval from a P value<br />
Douglas G Altman, 1 J Martin <strong>Bland</strong> 2<br />
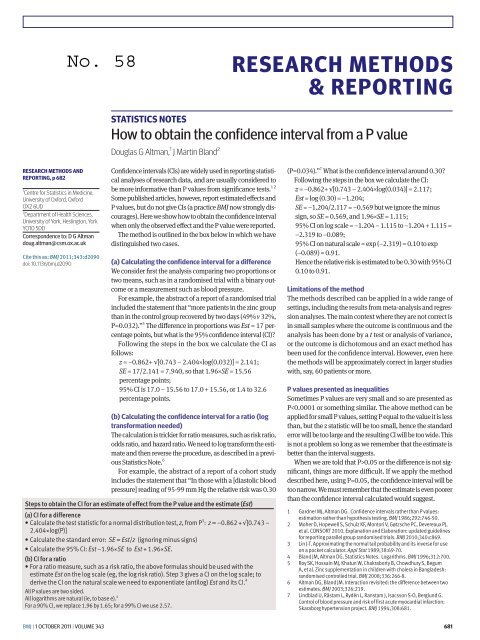
Confidence intervals (CIs) are widely used in reporting statistical<br />
analyses of research data, and are usually considered to<br />
1 2<br />
be more informative than P values from significance tests.<br />
Some published articles, however, report estimated effects and<br />
P values, but do not give CIs (a practice <strong>BMJ</strong> now strongly discourages).<br />
Here we show how to obtain the confidence interval<br />
when only the observed effect and the P value were reported.<br />
The method is outlined in the box below in which we have<br />
distinguished two cases.<br />
(a) Calculating the confidence interval for a difference<br />
We consider first the analysis comparing two proportions or<br />
two means, such as in a randomised trial with a binary outcome<br />
or a measurement such as blood pressure.<br />
For example, the abstract of a report of a randomised trial<br />
included the statement that “more patients in the zinc group<br />
than in the control group recovered <strong>by</strong> two days (49% v 32%,<br />
P=0.032).” 5 The difference in proportions was Est = 17 percentage<br />
points, but what is the 95% confidence interval (CI)?<br />
Following the steps in the box we calculate the CI as<br />
fo llows:<br />
z = –0.862+ √[0.743 – 2.404×log(0.032)] = 2.141;<br />
SE = 17/2.141 = 7.940, so that 1.96×SE = 15.56<br />
percentage points;<br />
95% CI is 17.0 – 15.56 to 17.0 + 15.56, or 1.4 to 32.6<br />
percentage points.<br />
(b) Calculating the confidence interval for a ratio (log<br />
transformation needed)<br />
The calculation is trickier for ratio measures, such as risk ratio,<br />
odds ratio, and hazard ratio. We need to log transform the estimate<br />
and then reverse the procedure, as described in a previous<br />
Statistics Note. 6<br />
For example, the abstract of a report of a cohort study<br />
includes the statement that “In those with a [diastolic blood<br />
pressure] reading of 95-99 mm Hg the relative risk was 0.30<br />
Steps to obtain the CI for an estimate of effect from the P value and the estimate (Est)<br />
(a) CI for a difference<br />
• Calculate the test statistic for a normal distribution test, z, from P 3 : z = −0.862 + √[0.743 −<br />
2.404×log(P)]<br />
• Calculate the standard error: SE = Est/z (ignoring minus signs)<br />
• Calculate the 95% CI: Est –1.96×SE to Est + 1.96×SE.<br />
(b) CI for a ratio<br />
• For a ratio measure, such as a risk ratio, the above formulas should be used with the<br />
estimate Est on the log scale (eg, the log risk ratio). Step 3 gives a CI on the log scale; to<br />
derive the CI on the natural scale we need to exponentiate (antilog) Est and its CI. 4<br />
All P values are two sided.<br />
All logarithms are natural (ie, to base e). 4<br />
For a 90% CI, we replace 1.96 <strong>by</strong> 1.65; for a 99% CI we use 2.57.<br />
(P=0.034).” 7 What is the confidence interval around 0.30?<br />
Following the steps in the box we calculate the CI:<br />
z = –0.862+ √[0.743 – 2.404×log(0.034)] = 2.117;<br />
Est = log (0.30) = −1.204;<br />
SE = −1.204/2.117 = −0.569 but we ignore the minus<br />
sign, so SE = 0.569, and 1.96×SE = 1.115;<br />
95% CI on log scale = −1.204 − 1.115 to −1.204 + 1.115 =<br />
−2.319 to −0.089;<br />
95% CI on natural scale = exp (−2.319) = 0.10 to exp<br />
(−0.089) = 0.91.<br />
Hence the relative risk is estimated to be 0.30 with 95% CI<br />
0.10 to 0.91.<br />
Limitations of the method<br />
The methods described can be applied in a wide range of<br />
settings, including the results from meta-analysis and regression<br />
analyses. The main context where they are not correct is<br />
in small samples where the outcome is continuous and the<br />
analysis has been done <strong>by</strong> a t test or analysis of variance,<br />
or the outcome is dichotomous and an exact method has<br />
been used for the confidence interval. However, even here<br />
the methods will be approximately correct in larger studies<br />
with, say, 60 patients or more.<br />
P values presented as inequalities<br />
Sometimes P values are very small and so are presented as<br />
P0.05 or the difference is not significant,<br />
things are more difficult. If we apply the method<br />
described here, using P=0.05, the confidence interval will be<br />
too narrow. We must remember that the estimate is even poorer<br />
than the confidence interval calculated would suggest.<br />
1 Gardner MJ, Altman DG. Confidence intervals rather than P values:<br />
estimation rather than hypothesis testing. <strong>BMJ</strong> 1986;292:746-50.<br />
2 Moher D, HopewellS,Schulz KF, MontoriV, Gøtzsche PC, DevereauxPJ,<br />
et al. CONSORT 2010. Explanation and Elaboration: updated guidelines<br />
for reporting parallel group randomised trials. <strong>BMJ</strong> 2010;340:c869.<br />
3 Lin J-T. Approximating the normal tail probability and its inverse for use<br />
on a pocket calculator. Appl Stat 1989;38:69-70.<br />
4 <strong>Bland</strong> <strong>JM</strong>, Altman DG.Statistics <strong>Notes</strong>. Logarithms. <strong>BMJ</strong> 1996;312:700.<br />
5 RoySK, Hossain MJ, Khatun W, Chakraborty B, ChowdhuryS, Begum<br />
A, et al. Zinc supplementation in children with cholera in Bangladesh:<br />
randomised controlled trial. <strong>BMJ</strong> 2008;336:266-8.<br />
6 Altman DG, <strong>Bland</strong> <strong>JM</strong>. Interaction revisited: the difference between two<br />
estimates. <strong>BMJ</strong> 2003;326:219.<br />
7 Lindblad U, Råstam L, Rydén L, Ranstam J, IsacssonS-O, Berglund G.<br />
Control of blood pressure and riskof first acute myocardial infarction:<br />
Skaraborg hypertension project. <strong>BMJ</strong> 1994;308:681.<br />
<strong>BMJ</strong> | 1 OCTOBER 2011 | VOLUME 343 681


