BMJ Statistical Notes Series List by JM Bland: http://www-users.york ...
BMJ Statistical Notes Series List by JM Bland: http://www-users.york ...
BMJ Statistical Notes Series List by JM Bland: http://www-users.york ...

You also want an ePaper? Increase the reach of your titles
YUMPU automatically turns print PDFs into web optimized ePapers that Google loves.
" "'.~..~~ ~.v~. a"uu,vu,-~ o'V'-" 'v UCla. u.C VL"~llL'" o.;VI1o.;urr~I11;<br />
complete destruction of the femoral head. Blood cultures infection. If the diagnosis is missed or delayed, the con-<br />
grew S auTeUS. His C reactive protein peaked at 122 sequences are serious: the joint destruction may<br />
mg/!. The hip was drained surgically of large amounts of preclude successful arthroplasty or, perhaps worse, a<br />
pus, culture of which grew S aureus and Proteus mirabi- hip replacement may be inserted into an unrecognised<br />
lis. He ~as treated with a prolonged course of high dose septic environment.<br />
antibiotics, with some clinical improvement but The most userJl non-specific tests seem to be the<br />
continuing poor mobility. erythrocyte sedimentation rate and measurement of C .<br />
n an ..~e~ctive ?ro~ein; the single most useful specific test is ~<br />
Her DIscussion Jomt asplranon and culture. .<br />
first These patients were all elderly and had pre-existing We recommend consideration of septic arthritis in<br />
ng/l. osteoarthritis and concurrent infection elsewhere. any patient with an apparently acute exacerbation of an<br />
pus None, however, had other systemic conditions predis- osteoarthritic joint, particularly if there is a possibility of<br />
nar'y posing to infection, such as diabetes, except for the sec- coexistent infection elsewhere. Other possible nonayed<br />
ond patient, who had a myeloproliferative disorder. The infective causes of a rapid deterioration in symptoms<br />
,ated development of septic arthritis <strong>by</strong> haematogenous include pseudogout and avascular necrosis, and these<br />
was spread was associated with increasing hip pain and will also need to be considered.<br />
: she rapid destruction of the femoral head. This was accom- Funding: None.<br />
1 few<br />
panied <strong>by</strong> a delay in diagnosis of up to six months.<br />
Infection in the presence of existing inflammatory<br />
Conflict ofinterest:None.<br />
ldio- joint disease, particularly rheumatoid arthritis, is well<br />
mtis known,' It is much rarer to see this in association with I Gardner GC, Weisman MH. Pyarthrosis in patients with rhewnatoid<br />
ISIng the much commoner osteoarthrins, although It IS<br />
arthritis,<br />
40 years.<br />
a<br />
Am<strong>JM</strong>ed<br />
report of<br />
1990;88:503-11.<br />
13 cases and a review of the literature from the past<br />
ttage<br />
mm<br />
recognised! In common with other bone and joint<br />
. m fi ectlOnS, . th e presentanon . 0 f sepnc . ar thr InS " has 2 Goldenberg DL, Cohen AS. Acute infectious arthritis. Am J Med<br />
3 Vincent 1976;60:369-77. GM, Amirault )D. Septic arthritis in the elderly. Chn Orthop<br />
)fhis<br />
with<br />
changed in recent years from the usual florid illness. 1991;251:241-5.<br />
leral<br />
atec-<br />
:rred .<br />
Statistics <strong>Notes</strong><br />
..<br />
Measurement error and correlation coefficients<br />
J Martin <strong>Bland</strong>, Douglas G Altman<br />
This is the 22nd in a series of Measurement error is the variation between measure- natural approach when investigating measurement error,<br />
occasional notes on medical ments of the same quantity on the same individual.! To this will inflate the correlation coefficient,<br />
statistics quantify measurement error we need repeated measure- The correlation coefficient between repeated measments<br />
on several subjects. We have discussed the urements is often called the reliability of the<br />
f within-subject standard deviation as an index of measurement method, It is widely used in the validation<br />
~ measurement error,! which we like as it has a simple of psychological measures such as scales of anxiety and<br />
( CliniCal interpretation. Here we consider the use of cor- depression, where it is known as the test-retest reliabilrelation<br />
coefficients to quantify measurement error, ity,ln such studies it is quoted for different populations<br />
1 A common design for the investigation of measurement (university students, psychiatric outpatients, etc)<br />
;teo- " error is to take pairs of measurements on a group of sub- because the correlation coefficient differs between them<br />
' . I<br />
jects, as in table 1. When we have pairs of observations it is as a result of differing ranges of the quantity being<br />
natural to plot one measurement against the other, The measured, The user has to select the correlation from<br />
resulting scatter diagram (see figure 1) may tempt us to the study population most like the user's own.<br />
Departm~nt of Public<br />
Healtb Sciences,<br />
S t G ~orge ' s H osp i t al<br />
calculate a correlation coefficient between the first and<br />
second measurement. There are difficulties in interpreting<br />
thi 1 . ffi . In al th 1 .<br />
between s corre repeated anon coe measurements Clent. gener, will depend e corre on anon the<br />
Another problem with the use of the correlation coefficient<br />
between the first and second measurements is<br />
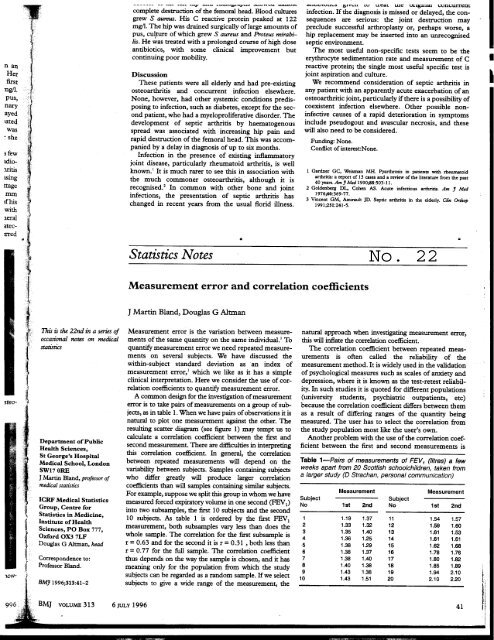
Table 1-Pairs of measurements of FEV 1 (Htres) a few<br />
Medical School, London variability between sub'ects. Samples containing subjects weeks apart from 20 Scottish schoolchildren, .tak~n from<br />
SW17 ORE<br />
J Martin <strong>Bland</strong>, professor of<br />
h<br />
W 0<br />
A,a- tl<br />
UL1Ler grea y<br />
will J .<br />
pro duce 1arger corre 1 anon .a larger study (0 Strachan, personal communication)<br />
medical statistics coefficients than will samples containing similar subjects'<br />
ICRF M d 1 S .,<br />
e lca tatlstlcs<br />
For example, suppose we split<br />
...easuremen<br />
this group m whom we have<br />
measured forced expiratory volume m one second (FEV J<br />
S b. u Jec<br />
I<br />
No<br />
M<br />
1 sl<br />
I<br />
2nd<br />
S<br />
u b.<br />
No Jec<br />
Measuremen I<br />
1 sl 2nd<br />
Group, Centre for into two subsamples, the first 10 subjects and the second<br />
Statistics in Medicine, 10 subjects. As table 1 is ordered <strong>by</strong> the first FEV I 1 1.19 1.37 11 1.54 1.57<br />
In~titute ofHealtb measurement, both subsamples vary less than does the 2 1.33 1.32 12 1.59 1.60<br />
ScIences, PO Box 777,<br />
Oxford OX3 7LF whole sample.<br />
Th<br />
e corre<br />
1 .<br />
anon<br />
fi<br />
or<br />
th firs<br />
e<br />
b<br />
t su samp<br />
1 .3<br />
e IS 4<br />
1.35<br />
1.36<br />
1.40<br />
1.25<br />
13<br />
14<br />
1.61<br />
1.61<br />
1.53<br />
1.61<br />
DougiasGAInnanhead r=0.63andfortheseconditisr=0.31,bothlessthan 5 1.36 1.29 15 1.62 1.68<br />
, r= 0.77 for the full sample. The correlation coefficient 6 1.38 1.37 16 1.78 1.76<br />
Correspondence to: thus depends on the way the sample is chosen, and it has 7 1.38 1.40 17 1.80 1.82<br />
Professor <strong>Bland</strong>. meaning only for the population from which the stUdY: ~::~ ~:~:~: ~:: ~:~~ l<br />
subjects can be regarded as a random sample. If we select 10 1.431.51 20 2.102.20 l<br />
EMJ 1996;313:41-2 subjects to give a wide range of the measurement, the Ii<br />
8M] VOLUME313 6 JULy 1996 41 H<br />
I<br />
i<br />
I<br />
i