On the Identification of Misspecified Propensity Scores - School of ...
On the Identification of Misspecified Propensity Scores - School of ...
On the Identification of Misspecified Propensity Scores - School of ...

Create successful ePaper yourself
Turn your PDF publications into a flip-book with our unique Google optimized e-Paper software.
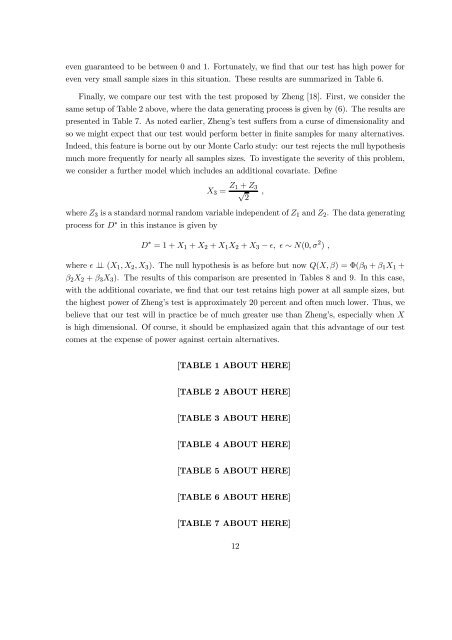
even guaranteed to be between 0 and 1. Fortunately, we find that our test has high power for<br />
even very small sample sizes in this situation. These results are summarized in Table 6.<br />
Finally, we compare our test with <strong>the</strong> test proposed by Zheng [18]. First, we consider <strong>the</strong><br />
same setup <strong>of</strong> Table 2 above, where <strong>the</strong> data generating process is given by (6). The results are<br />
presented in Table 7. As noted earlier, Zheng’s test suffers from a curse <strong>of</strong> dimensionality and<br />
so we might expect that our test would perform better in finite samples for many alternatives.<br />
Indeed, this feature is borne out by our Monte Carlo study: our test rejects <strong>the</strong> null hypo<strong>the</strong>sis<br />
much more frequently for nearly all samples sizes. To investigate <strong>the</strong> severity <strong>of</strong> this problem,<br />
we consider a fur<strong>the</strong>r model which includes an additional covariate. Define<br />
X3 = Z1 + Z3<br />
√<br />
2<br />
where Z3 is a standard normal random variable independent <strong>of</strong> Z1 and Z2. The data generating<br />
process for D ∗ in this instance is given by<br />
D ∗ = 1 + X1 + X2 + X1X2 + X3 − ǫ, ǫ ∼ N(0, σ 2 ) ,<br />
where ǫ ⊥ (X1, X2, X3). The null hypo<strong>the</strong>sis is as before but now Q(X, β) = Φ(β0 + β1X1 +<br />
β2X2 + β3X3). The results <strong>of</strong> this comparison are presented in Tables 8 and 9. In this case,<br />
with <strong>the</strong> additional covariate, we find that our test retains high power at all sample sizes, but<br />
<strong>the</strong> highest power <strong>of</strong> Zheng’s test is approximately 20 percent and <strong>of</strong>ten much lower. Thus, we<br />
believe that our test will in practice be <strong>of</strong> much greater use than Zheng’s, especially when X<br />
is high dimensional. Of course, it should be emphasized again that this advantage <strong>of</strong> our test<br />
comes at <strong>the</strong> expense <strong>of</strong> power against certain alternatives.<br />
[TABLE 1 ABOUT HERE]<br />
[TABLE 2 ABOUT HERE]<br />
[TABLE 3 ABOUT HERE]<br />
[TABLE 4 ABOUT HERE]<br />
[TABLE 5 ABOUT HERE]<br />
[TABLE 6 ABOUT HERE]<br />
[TABLE 7 ABOUT HERE]<br />
12<br />
,