On the Identification of Misspecified Propensity Scores - School of ...
On the Identification of Misspecified Propensity Scores - School of ...
On the Identification of Misspecified Propensity Scores - School of ...

Create successful ePaper yourself
Turn your PDF publications into a flip-book with our unique Google optimized e-Paper software.
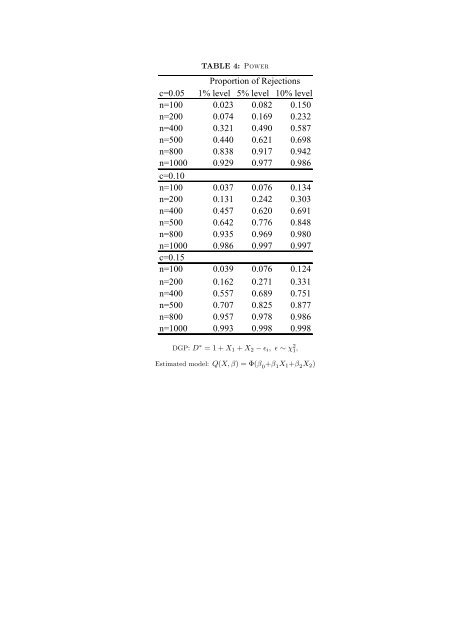
TABLE 4: P<br />
c=0.05<br />
Proportion <strong>of</strong> Rejections<br />
1% level 5% level 10% level<br />
n=100 0.023 0.082 0.150<br />
n=200 0.074 0.169 0.232<br />
n=400 0.321 0.490 0.587<br />
n=500 0.440 0.621 0.698<br />
n=800 0.838 0.917 0.942<br />
n=1000<br />
c=0.10<br />
0.929 0.977 0.986<br />
n=100 0.037 0.076 0.134<br />
n=200 0.131 0.242 0.303<br />
n=400 0.457 0.620 0.691<br />
n=500 0.642 0.776 0.848<br />
n=800 0.935 0.969 0.980<br />
n=1000<br />
c=0.15<br />
0.986 0.997 0.997<br />
n=100 0.039 0.076 0.124<br />
n=200 0.162 0.271 0.331<br />
n=400 0.557 0.689 0.751<br />
n=500 0.707 0.825 0.877<br />
n=800 0.957 0.978 0.986<br />
n=1000 0.993 0.998 0.998<br />
DGP: D ∗ = 1 + X1 + X2 − ǫi, ǫ ∼ χ 2 1 ,<br />
Estimated model: Q(X, β) = Φ(β 0 +β 1 X1+β 2 X2)