On the Identification of Misspecified Propensity Scores - School of ...
On the Identification of Misspecified Propensity Scores - School of ...
On the Identification of Misspecified Propensity Scores - School of ...

Create successful ePaper yourself
Turn your PDF publications into a flip-book with our unique Google optimized e-Paper software.
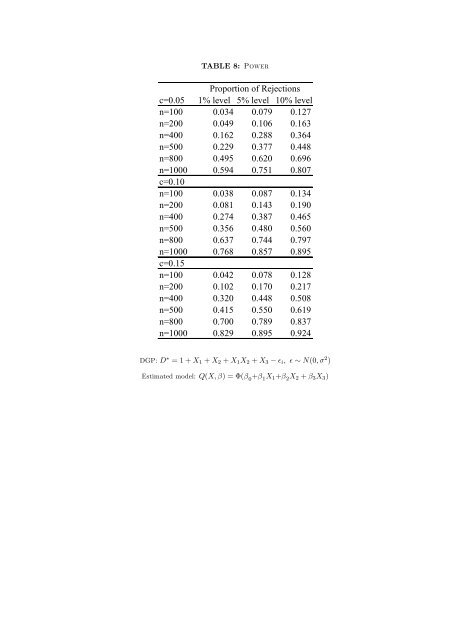
TABLE 8: P<br />
c=0.05<br />
Proportion <strong>of</strong> Rejections<br />
1% level 5% level 10% level<br />
n=100 0.034 0.079 0.127<br />
n=200 0.049 0.106 0.163<br />
n=400 0.162 0.288 0.364<br />
n=500 0.229 0.377 0.448<br />
n=800 0.495 0.620 0.696<br />
n=1000<br />
c=0.10<br />
0.594 0.751 0.807<br />
n=100 0.038 0.087 0.134<br />
n=200 0.081 0.143 0.190<br />
n=400 0.274 0.387 0.465<br />
n=500 0.356 0.480 0.560<br />
n=800 0.637 0.744 0.797<br />
n=1000<br />
c=0.15<br />
0.768 0.857 0.895<br />
n=100 0.042 0.078 0.128<br />
n=200 0.102 0.170 0.217<br />
n=400 0.320 0.448 0.508<br />
n=500 0.415 0.550 0.619<br />
n=800 0.700 0.789 0.837<br />
n=1000 0.829 0.895 0.924<br />
DGP: D ∗ = 1 + X1 + X2 + X1X2 + X3 − ǫi, ǫ ∼ N(0, σ 2 )<br />
Estimated model: Q(X, β) = Φ(β 0 +β 1X1+β 2X2 + β3X3)