On the Identification of Misspecified Propensity Scores - School of ...
On the Identification of Misspecified Propensity Scores - School of ...
On the Identification of Misspecified Propensity Scores - School of ...

You also want an ePaper? Increase the reach of your titles
YUMPU automatically turns print PDFs into web optimized ePapers that Google loves.
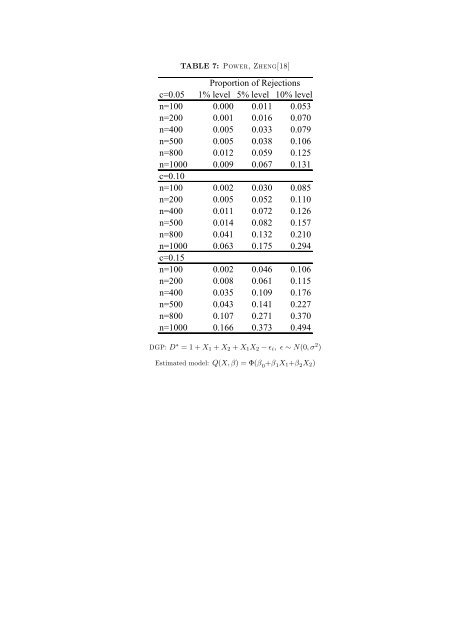
TABLE 7: P, Z[18]<br />
c=0.05<br />
Proportion <strong>of</strong> Rejections<br />
1% level 5% level 10% level<br />
n=100 0.000 0.011 0.053<br />
n=200 0.001 0.016 0.070<br />
n=400 0.005 0.033 0.079<br />
n=500 0.005 0.038 0.106<br />
n=800 0.012 0.059 0.125<br />
n=1000<br />
c=0.10<br />
0.009 0.067 0.131<br />
n=100 0.002 0.030 0.085<br />
n=200 0.005 0.052 0.110<br />
n=400 0.011 0.072 0.126<br />
n=500 0.014 0.082 0.157<br />
n=800 0.041 0.132 0.210<br />
n=1000<br />
c=0.15<br />
0.063 0.175 0.294<br />
n=100 0.002 0.046 0.106<br />
n=200 0.008 0.061 0.115<br />
n=400 0.035 0.109 0.176<br />
n=500 0.043 0.141 0.227<br />
n=800 0.107 0.271 0.370<br />
n=1000 0.166 0.373 0.494<br />
DGP: D ∗ = 1 + X1 + X2 + X1X2 − ǫi, ǫ ∼ N(0, σ 2 )<br />
Estimated model: Q(X, β) = Φ(β 0 +β 1X1+β 2X2)