On the Identification of Misspecified Propensity Scores - School of ...
On the Identification of Misspecified Propensity Scores - School of ...
On the Identification of Misspecified Propensity Scores - School of ...

Create successful ePaper yourself
Turn your PDF publications into a flip-book with our unique Google optimized e-Paper software.
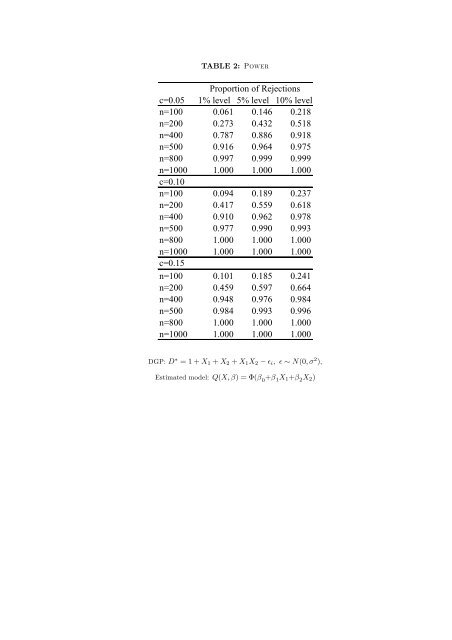
TABLE 2: P<br />
c=0.05<br />
Proportion <strong>of</strong> Rejections<br />
1% level 5% level 10% level<br />
n=100 0.061 0.146 0.218<br />
n=200 0.273 0.432 0.518<br />
n=400 0.787 0.886 0.918<br />
n=500 0.916 0.964 0.975<br />
n=800 0.997 0.999 0.999<br />
n=1000<br />
c=0.10<br />
1.000 1.000 1.000<br />
n=100 0.094 0.189 0.237<br />
n=200 0.417 0.559 0.618<br />
n=400 0.910 0.962 0.978<br />
n=500 0.977 0.990 0.993<br />
n=800 1.000 1.000 1.000<br />
n=1000<br />
c=0.15<br />
1.000 1.000 1.000<br />
n=100 0.101 0.185 0.241<br />
n=200 0.459 0.597 0.664<br />
n=400 0.948 0.976 0.984<br />
n=500 0.984 0.993 0.996<br />
n=800 1.000 1.000 1.000<br />
n=1000 1.000 1.000 1.000<br />
DGP: D ∗ = 1 + X1 + X2 + X1X2 − ǫi, ǫ ∼ N(0, σ 2 ),<br />
Estimated model: Q(X, β) = Φ(β 0 +β 1X1+β 2X2)