On the Identification of Misspecified Propensity Scores - School of ...
On the Identification of Misspecified Propensity Scores - School of ...
On the Identification of Misspecified Propensity Scores - School of ...

Create successful ePaper yourself
Turn your PDF publications into a flip-book with our unique Google optimized e-Paper software.
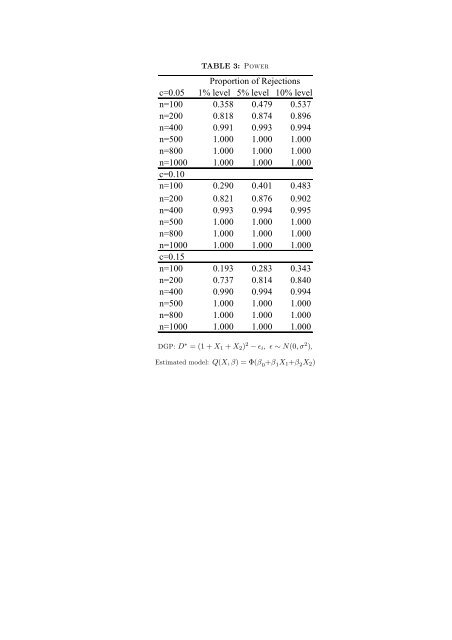
TABLE 3: P<br />
c=0.05<br />
Proportion <strong>of</strong> Rejections<br />
1% level 5% level 10% level<br />
n=100 0.358 0.479 0.537<br />
n=200 0.818 0.874 0.896<br />
n=400 0.991 0.993 0.994<br />
n=500 1.000 1.000 1.000<br />
n=800 1.000 1.000 1.000<br />
n=1000<br />
c=0.10<br />
1.000 1.000 1.000<br />
n=100 0.290 0.401 0.483<br />
n=200 0.821 0.876 0.902<br />
n=400 0.993 0.994 0.995<br />
n=500 1.000 1.000 1.000<br />
n=800 1.000 1.000 1.000<br />
n=1000<br />
c=0.15<br />
1.000 1.000 1.000<br />
n=100 0.193 0.283 0.343<br />
n=200 0.737 0.814 0.840<br />
n=400 0.990 0.994 0.994<br />
n=500 1.000 1.000 1.000<br />
n=800 1.000 1.000 1.000<br />
n=1000 1.000 1.000 1.000<br />
DGP: D ∗ = (1 + X1 + X2) 2 − ǫi, ǫ ∼ N(0, σ 2 ),<br />
Estimated model: Q(X, β) = Φ(β 0 +β 1X1+β 2X2)