IB Econ Study Guide Internationals - Sunny Hills High School
IB Econ Study Guide Internationals - Sunny Hills High School
IB Econ Study Guide Internationals - Sunny Hills High School

Create successful ePaper yourself
Turn your PDF publications into a flip-book with our unique Google optimized e-Paper software.
The terms strictly refer to offlc,a/ changes in the price (the<br />
value) of a currency in a f,ixed exchange rate system.<br />
More specifically, a currency devalues if its official price<br />
decreases within a fixed exchange rate system. A currency<br />
revalues if its official Drice increases within a fixed<br />
exchanoe rate svstem.<br />
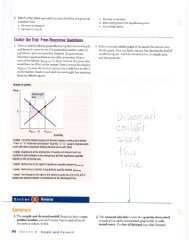
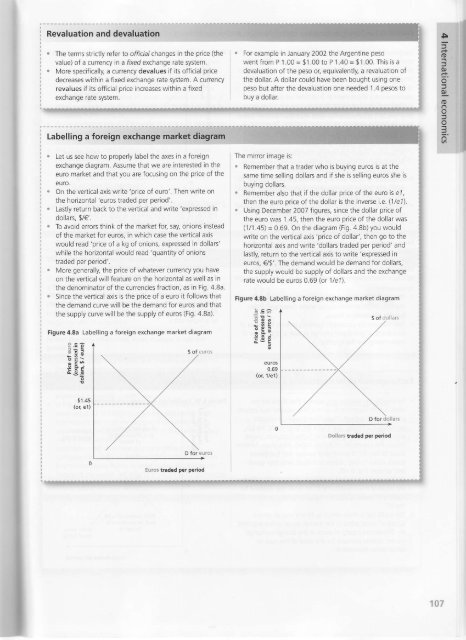
Let us see how to properly label ihe axes in a foreign<br />
exchange diagram. Assume that we are interested in the<br />
euro market and that you are focusing on the price of the<br />
euro.<br />
on the vertical axis write 'price of euro'. Then write on<br />
the horizontal 'euros traded oer oeriod'.<br />
Lastly return back to the vertical and write 'expressed in<br />
dollars, $/€'.<br />
To avoid errors think of the market for. say, onions instead<br />
of the market for euros, in which case the vertical axis<br />
would read 'price of a kg of onions, expressed in dollars'<br />
while the horizontal would read 'quantity of onions<br />
traded Der oeriod'.<br />
l\4ore generally, the price of whatever currency you have<br />
on the vertical will {eature on the horizontal as well as in<br />
the denominator of the currencies fraction, as in Fig. 4.8a.<br />
Since the vertical axis is the price of a euro it follows that<br />
the demand curve will be the demand for euros and that<br />
the supply curve will be the supply of euros (Fig, 4,8a).<br />
Figure 4.8a Labelling a foreign exchange market diagram<br />
:*d<br />
.E Sc<br />
a -9 -g E<br />
$1.4s<br />
(or, el)<br />
Euros traded per period<br />
. For example in January 2002 the Argentine peso<br />
went from P 1.00 = $1.00 to P 1.40 = $1.00. This is a<br />
devaluation of the peso or, equivalently, a revaluation of<br />
the dollar A dollar could have been bought using one<br />
peso but after the devaluation one needed 1.4 pesos to<br />
buy a dollar.<br />
The mirror image is:<br />
Remember that a trader who is buying euros is at the<br />
same time selling dollars and if she is selling euros she is<br />
buying dollars.<br />
Remember also that if the dollar price of the euro is e/,<br />
then the euro price of the dollar is the inverse i.e. (1/e7).<br />
Using December 2007 figures, since the dollar price of<br />
the euro was 1.45, then the euro price of the dollar was<br />
(1/1 .45) = o.69. On the diagram (Fig. 4.8b) you would<br />
write on the vertical axis 'price of dollar', then go to the<br />
horizontal axis and write 'dollars traded oer Deriod' and<br />
lastly, return to the vertical axis to write 'expressed in<br />
euros, €/$'. The demand would be demand for dollars,<br />
the supply would be supply of dollars and the exchange<br />
rate would be euros 0.69 (or]/e7).<br />
Figure 4.8b Labelling a foreign exchange market diagram<br />
ir-<br />
:fe<br />
ogf,<br />
#sp<br />
euros<br />
0.69<br />
{o[ 1/e1)<br />
s ol dolla15<br />
Dollars traded p€r poriod