Scientific Advisory Board - Erich Schmid Institute
Scientific Advisory Board - Erich Schmid Institute
Scientific Advisory Board - Erich Schmid Institute

You also want an ePaper? Increase the reach of your titles
YUMPU automatically turns print PDFs into web optimized ePapers that Google loves.
ERICH SCHMID INSTITUTE OF MATERIALS SCIENCE<br />
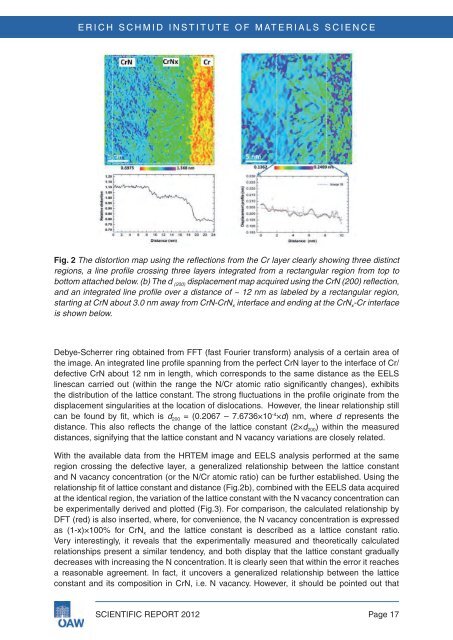
Fig . 2 The distortion map using the reflections from the Cr layer clearly showing three distinct<br />
regions, a line profile crossing three layers integrated from a rectangular region from top to<br />
bottom attached below. (b) The d (200) displacement map acquired using the CrN (200) reflection,<br />
and an integrated line profile over a distance of ~ 12 nm as labeled by a rectangular region,<br />
starting at CrN about 3.0 nm away from CrN-CrN x interface and ending at the CrN x-Cr interface<br />
is shown below.<br />
debye-Scherrer ring obtained from fft (fast fourier transform) analysis of a certain area of<br />
the image. An integrated line profile spanning from the perfect crn layer to the interface of cr/<br />
defective crn about 12 nm in length, which corresponds to the same distance as the eeLS<br />
linescan carried out (within the range the n/cr atomic ratio significantly changes), exhibits<br />
the distribution of the lattice constant. the strong fluctuations in the profile originate from the<br />
displacement singularities at the location of dislocations. However, the linear relationship still<br />
can be found by fit, which is d 200 = (0.2067 – 7.6736×10 -4 ×d) nm, where d represents the<br />
distance. this also reflects the change of the lattice constant (2×d 200) within the measured<br />
distances, signifying that the lattice constant and n vacancy variations are closely related.<br />
With the available data from the HRtem image and eeLS analysis performed at the same<br />
region crossing the defective layer, a generalized relationship between the lattice constant<br />
and n vacancy concentration (or the n/cr atomic ratio) can be further established. Using the<br />
relationship fit of lattice constant and distance (fig.2b), combined with the eeLS data acquired<br />
at the identical region, the variation of the lattice constant with the n vacancy concentration can<br />
be experimentally derived and plotted (fig.3). for comparison, the calculated relationship by<br />
dft (red) is also inserted, where, for convenience, the n vacancy concentration is expressed<br />
as (1-x)×100% for crn x and the lattice constant is described as a lattice constant ratio.<br />
Very interestingly, it reveals that the experimentally measured and theoretically calculated<br />
relationships present a similar tendency, and both display that the lattice constant gradually<br />
decreases with increasing the n concentration. it is clearly seen that within the error it reaches<br />
a reasonable agreement. in fact, it uncovers a generalized relationship between the lattice<br />
constant and its composition in crn, i.e. n vacancy. However, it should be pointed out that<br />
<strong>Scientific</strong> RepoRt 2012 page 17