dissertation global and local fracture properties of metal matrix ...
dissertation global and local fracture properties of metal matrix ...
dissertation global and local fracture properties of metal matrix ...

You also want an ePaper? Increase the reach of your titles
YUMPU automatically turns print PDFs into web optimized ePapers that Google loves.
1 µm<br />
Section 7<br />
5 µm<br />
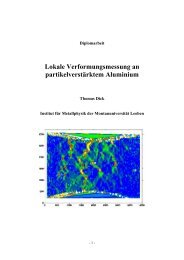
Fig. 7.3. A schematic view <strong>of</strong> the quadrat method for the PM-MMC Al6061-20%Al2O3.<br />
The major problem <strong>of</strong> the quadrat method is to determine the optimum quadrat size. Non-<br />
r<strong>and</strong>omness is highly dependent on the size <strong>of</strong> the sample quadrat. In this study, the problem<br />
becomes more complicated due to the difference in the size <strong>of</strong> the reinforcements. According<br />
to [82], the optimum quadrat size is twice the size <strong>of</strong> the mean area per particle. If for our<br />
material the particle size is set to 3 µm (which lies in the middle <strong>of</strong> the range <strong>of</strong> observed<br />
particle sizes), the quadrat size becomes a = 8.5 µm. Qualitative analysis <strong>of</strong> the<br />
microstructures shows that this quadrat size seems to be the optimum value for this<br />
investigation. In Figure 7.3, a schematic view <strong>of</strong> the quadrat method for our case is presented.<br />
The particles that belong to different quadrats are painted in different colours. One can see<br />
that a lower a-value could artificially decrease the number <strong>of</strong> particles in the quadrats<br />
corresponding to clusters containing large particles (5 µm). At the same time, higher a-values<br />
could significantly decrease the number <strong>of</strong> empty quadrats <strong>and</strong> tend to give the same number<br />
<strong>of</strong> particles in each quadrat, irrespective <strong>of</strong> the presence <strong>of</strong> clusters.<br />
For the microstructural investigation, the rods are sectioned in the longitudinal direction,<br />
grinded, polished, <strong>and</strong> investigated in the SEM. 9 micrographs from the center region <strong>of</strong> the<br />
specimens are taken in the SEM, each covering an area <strong>of</strong> 130×100 µm. Each image is<br />
divided into 140 quadrats. The histograms <strong>of</strong> the particle per quadrat distribution for each<br />
material condition are plotted. These histograms are compared with theoretical distributions:<br />
84<br />
a =8.5 µm