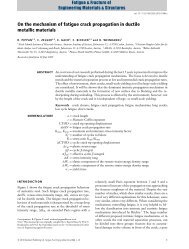
a) b) Frequency [%] Frequency [%] Frequency [%] 30 25 20 15 10 5 0 30 25 20 15 10 5 0 30 25 20 15 10 5 0 Section 7 0 5 10 15 20 N q 0 5 10 15 20 N q 0 5 10 15 20 N q 87 Poisson distrubution experimental data Negative binomial distribution Poisson distribution experimental data Negative binomial distribution Poisson distribution experimental data Negative binomial distribution c) Fig. 7.5. Theoretical distribution curves <strong>and</strong> experimental results from the quadrat analysis <strong>of</strong> the PM MMC Al6061-20%Al2O3: a) in as-fabricated condition, b) after 4 ECAP passes, c) after 7 ECAP passes.
Section 7 It is important that no particle breaking during the ECAP is observed: the number <strong>of</strong> particles per quadrat, µ, are 6.2, 5.9, <strong>and</strong> 6.7 for the initial state, after 4, <strong>and</strong> 7 ECAP passes, respectively. It should be further noted that no voids are observed in the investigated material after 7 ECAP passes. 7.4.2. The effect <strong>of</strong> ECAP on the <strong>global</strong> <strong>fracture</strong> <strong>properties</strong> Grinded <strong>and</strong> polished tensile specimens with a gage length <strong>of</strong> 10 mm <strong>and</strong> a quadratic section <strong>of</strong> 2x2 mm are used for tensile tests. Disk-shaped compact specimens similar to that presented in Fig. 4.8 is used to perform <strong>fracture</strong> tests. Specimens for mechanical tests are annealed at 530°C for 1h, quenched in water, <strong>and</strong> aged at 175°C for 15min. which corresponds to an under-aged condition. This heat treatment is chosen because <strong>of</strong> the low <strong>fracture</strong> toughness <strong>of</strong> the MMC. As was already mentioned in Section 2, MMCs in the under-aged condition have the highest <strong>fracture</strong> toughness. In our case, a high <strong>fracture</strong> toughness would be advantageous to compare the <strong>fracture</strong> <strong>properties</strong> <strong>of</strong> the material. In Table 7.2, the results <strong>of</strong> mechanical tensile tests are listed. No significant difference between the yield strength, σy, ultimate tensile strength, σu, the strain hardening coefficient, N, <strong>and</strong> the <strong>fracture</strong> strain, εfr, is found for considered materials. In Figure 7.6, the J-∆a curves determined according to [70] for all tested disk compact specimens are given. The values <strong>of</strong> the <strong>fracture</strong> toughness, J0.2, the maximum extension <strong>of</strong> the stable crack propagation, ∆astab, the slope <strong>of</strong> the J-∆a-curve, dJ/d(∆a), in the range between the ∆a = 0.2 mm <strong>and</strong> ∆astab are listed in Table 7.2, as well. A tendency to increase <strong>of</strong> the J0.2-, the dJ/d(∆a)-, <strong>and</strong> the ∆astab-values with increasing homogeneity <strong>of</strong> the particle distribution can be noted. Evolution <strong>of</strong> the slope <strong>of</strong> the J-∆a curve, dJ/d(∆a), is especially interesting, as this parameter is a measure <strong>of</strong> the total crack growth resistance in material, Rtot, [50, 84]. In [50], the relation Number <strong>of</strong> ECAP passes Table 7.2. Data on mechanical <strong>properties</strong> <strong>of</strong> the PM-MMC Al6061-20%Al2O3. σy [MPa] σu [MPa] N εfr [%] 88 J0.2/Bl [kN/m] dJ/d(∆a) ∆astab [mm] 0 225 287 0.11 3.0 1.5 1.93 0.42 7.7 4 230 315 0.12 4.2 1.7 2.50 0.72 10.3 Rtot [kJ/m 2 ] 7 230 306 0.12 3.5 2.7 3.88 1.05 15.4