development of micro-pattern gaseous detectors – gem - LMU
development of micro-pattern gaseous detectors – gem - LMU
development of micro-pattern gaseous detectors – gem - LMU

Create successful ePaper yourself
Turn your PDF publications into a flip-book with our unique Google optimized e-Paper software.
52 Chapter 4 Energy Resolution and Pulse Height Analysis<br />
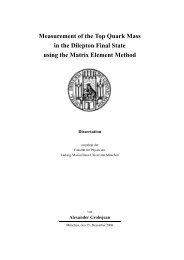
observes a greater pulse height for all three configuration at Edri ft = 1.25 kV/cm. This is followed by<br />
a slight decrease going to higher drift fields. One assumes that this may be due to electric field lines<br />
ending on the upper electrode <strong>of</strong> GEM3 preventing them from being amplified in the GEM foils.<br />
pulse height [0.244 mV]<br />
22<br />
20<br />
18<br />
16<br />
14<br />
12<br />
10<br />
8<br />
6<br />
4<br />
Cosmics Pulse Height vs E<br />
drift<br />
Δ UGEM3<br />
= 330 V<br />
Δ UGEM2<br />
= 290 V<br />
Δ UGEM1<br />
= 320 V<br />
Cu anode unseg<br />
preamp: CATSA82<br />
Ar:CO2<br />
93:7 @ 1 bar<br />
cm<br />
kV<br />
Etrans1,2<br />
= Eind<br />
= 1.30<br />
cm<br />
kV<br />
Etrans1,2<br />
= Eind<br />
= 1.70<br />
cm<br />
kV<br />
Etrans1,2<br />
= Eind<br />
= 2.00<br />
0.9 1 1.1 1.2 1.3 1.4 1.5 1.6 1.7<br />
Edrift[kV/cm]<br />
Figure 4.19: MPV <strong>of</strong> the Landau spectra as a function <strong>of</strong> Edri ft at constant Etrans1,2 = Eind<br />
This may be just a part <strong>of</strong> the answer since the physical processes in a triple GEM detector are very<br />
complicated [Buzu 02]. Nevertheless, these effects result only in a small variation <strong>of</strong> 5% in the pulse<br />
height concerning measurements at constant Eind = Etrans1,2 = 1.7 kV/cm.<br />
4.5 Pulse Height Dependence on Strip Readout<br />
The five-fold segmented anode was used to study the influence <strong>of</strong> strip size on the pulse height <strong>of</strong> the<br />
anode signals. Five data points were taken when one, two, three, four and all five strips were readout<br />
by one preamplifier. The dimension <strong>of</strong> a single readout strip is shown in Fig. 4.20. We used the<br />
55 Fe source located at the central position and recorded data samples with all three preamplifiers. The<br />
readout copper strips <strong>of</strong> the five-fold segmented anode were coupled together while open strips were<br />
connected with a resistor <strong>of</strong> 100 Ω to ground as shown in Fig. 4.20. Fig. 4.21 repeats schematically<br />
the capacities and charge flows necessary for the following calculations. Foremost, data samples with<br />
40000 events taken with the CATSA82 preamplifier can bee seen in Fig. 4.22. For comparison, the<br />
operation parameters were chosen to be identical to a setup with unsegmented anode (round data point<br />
in Fig. 4.22). The pulse height is decreasing as more strips are readout being coupled together. This<br />
results in a 50% smaller peak for five stripr being read out compared to only one strip-readout. The<br />
unsegmented anode shows the lowest pulse height <strong>of</strong> the 55 Fe spectrum.<br />
One observes for all preamplifiers a decreasing pulse height with increasing strip number, see<br />
Fig. 4.23. This plot shows measurements at identical operation parameters recorded once with the<br />
Canberra preamplifier and repeated with the ELab version.<br />
The detected charge Qtot flows from the anode (Cdet) to the coupling capacitor Ccoup. At equilibrium<br />
the voltage on Cdet and Ccoup is identical: