regional strategy south-west-styria - EU-Regionalmanagement ...
regional strategy south-west-styria - EU-Regionalmanagement ...
regional strategy south-west-styria - EU-Regionalmanagement ...

Create successful ePaper yourself
Turn your PDF publications into a flip-book with our unique Google optimized e-Paper software.
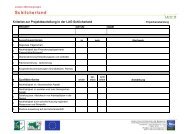
The detailed analysis indicates that the strong immigration in the Styrian central region is due<br />
to two factors. First, the central region is the main destination of the cross-border migration and<br />
therefore profits most from immigration. Second, it can be seen that a large number of people<br />
from the surrounding districts move to the center. This results in a negative migration balance<br />
in the suburbs and a positive migration balance in the central area. Both regions, South-West<br />
Styria and East-Styria, profit from immigration of foreigners as well as from people moving from<br />
different Styrian regions to these areas.<br />
Analysis of the population development 2011-2012<br />
Population 2012<br />
Population 2011<br />
Development 2011<br />
to 2012<br />
Immigration of<br />
indigenous people<br />
of that<br />
Immigration of<br />
foreigners of that<br />
Styria 1.213.255 1.210.614 0,22% 2,73% 1,13% 3,54% 0,32% 0,84% 0,96% -0,12%<br />
Regions<br />
South-West Styria 138.207 138.140 0,05% 2,30% 0,61% 2,76% 0,15% 0,82% 0,95% -0,13%<br />
East-Styria 177.287 177.053 0,13% 2,00% 0,67% 2,57% 0,09% 0,94% 0,91% 0,03%<br />
Styrian Central Region 460.842 456.335 0,99% 4,09% 1,66% 4,79% 0,96% 0,89% 0,89% 0,00%<br />
South-East Styria 89.575 89.957 -0,42% 1,85% 0,55% 2,74% -0,34% 0,85% 0,95% -0,10%<br />
Upper Styria East 164.839 165.811 -0,59% 2,15% 1,00% 3,24% -0,10% 0,69% 1,19% -0,49%<br />
Upper Styria West 103.035 103.504 -0,45% 1,45% 0,94% 2,55% -0,17% 0,78% 1,09% -0,31%<br />
Liezen 79.470 79.814 -0,43% 1,26% 1,12% 2,65% -0,27% 0,77% 0,94% -0,17%<br />
Districts<br />
Graz-City 265.318 261.540 1,44% 4,69% 2,35% 5,74% 1,30% 0,95% 0,83% 0,12%<br />
Bruck an der Mur 62.155 62.500 -0,55% 2,06% 1,05% 3,25% -0,14% 0,71% 1,17% -0,46%<br />
Deutschlandsberg 60.762 60.851 -0,15% 2,15% 0,47% 2,55% 0,07% 0,76% 1,01% -0,24%<br />
Feldbach 66.828 67.046 -0,33% 1,77% 0,54% 2,62% -0,31% 0,86% 0,89% -0,03%<br />
Fürstenfeld 22.765 22.797 -0,14% 3,18% 0,82% 3,93% 0,07% 0,79% 1,06% -0,28%<br />
Page 9 / 53<br />
This project is implemented through the CENTRAL <strong>EU</strong>ROPE Programme co -financed by the ERDF<br />
Emigration of that<br />
Migration balance<br />
Births of that<br />
Deaths of that<br />
Birth rates (births<br />
and deaths)