

Fiat Group - Consolidated Financial Statements and Notes - Fiat SpA
Fiat Group - Consolidated Financial Statements and Notes - Fiat SpA
Fiat Group - Consolidated Financial Statements and Notes - Fiat SpA

Create successful ePaper yourself
Turn your PDF publications into a flip-book with our unique Google optimized e-Paper software.
170<br />
<strong>Consolidated</strong><br />
<strong>Financial</strong><br />
<strong>Statements</strong><br />
at 31 December<br />
2011<br />
<strong>Notes</strong><br />
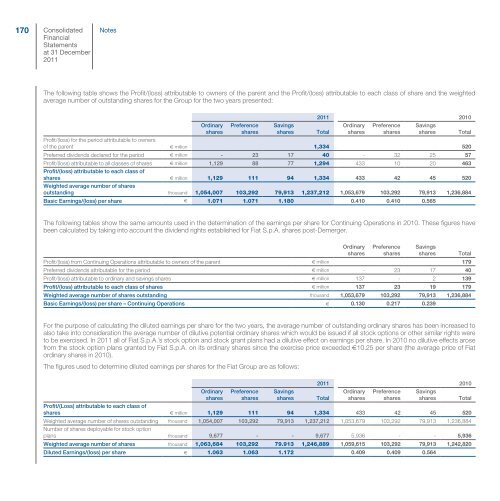
The following table shows the Profit/(loss) attributable to owners of the parent <strong>and</strong> the Profit/(loss) attributable to each class of share <strong>and</strong> the weighted<br />
average number of outst<strong>and</strong>ing shares for the <strong>Group</strong> for the two years presented:<br />
Ordinary<br />
shares<br />
Preference<br />
shares<br />
Savings<br />
shares Total<br />
2011 2010<br />
Ordinary<br />
shares<br />
Preference<br />
shares<br />
Savings<br />
shares Total<br />
Profit/(loss) for the period attributable to owners<br />
of the parent € million 1,334 520<br />
Preferred dividends declared for the period € million - 23 17 40 - 32 25 57<br />
Profit/(loss) attributable to all classes of shares<br />
Profit/(loss) attributable to each class of<br />
€ million 1,129 88 77 1,294 433 10 20 463<br />
shares<br />
Weighted average number of shares<br />
€ million 1,129 111 94 1,334 433 42 45 520<br />
outst<strong>and</strong>ing thous<strong>and</strong> 1,054,007 103,292 79,913 1,237,212 1,053,679 103,292 79,913 1,236,884<br />
Basic Earnings/(loss) per share € 1.071 1.071 1.180 0.410 0.410 0.565<br />
The following tables show the same amounts used in the determination of the earnings per share for Continuing Operations in 2010. These figures have<br />
been calculated by taking into account the dividend rights established for <strong>Fiat</strong> S.p.A. shares post-Demerger.<br />
Ordinary<br />
shares<br />
Preference<br />
shares<br />
Savings<br />
shares Total<br />
Profit/(loss) from Continuing Operations attributable to owners of the parent € million 179<br />
Preferred dividends attributable for the period € million - 23 17 40<br />
Profit/(loss) attributable to ordinary <strong>and</strong> savings shares € million 137 - 2 139<br />
Profit/(loss) attributable to each class of shares € million 137 23 19 179<br />
Weighted average number of shares outst<strong>and</strong>ing thous<strong>and</strong> 1,053,679 103,292 79,913 1,236,884<br />
Basic Earnings/(loss) per share – Continuing Operations € 0.130 0.217 0.239<br />
For the purpose of calculating the diluted earnings per share for the two years, the average number of outst<strong>and</strong>ing ordinary shares has been increased to<br />
also take into consideration the average number of dilutive potential ordinary shares which would be issued if all stock options or other similar rights were<br />
to be exercised. In 2011 all of <strong>Fiat</strong> S.p.A.’s stock option <strong>and</strong> stock grant plans had a dilutive effect on earnings per share. In 2010 no dilutive effects arose<br />
from the stock option plans granted by <strong>Fiat</strong> S.p.A. on its ordinary shares since the exercise price exceeded €10.25 per share (the average price of <strong>Fiat</strong><br />
ordinary shares in 2010).<br />
The figures used to determine diluted earnings per shares for the <strong>Fiat</strong> <strong>Group</strong> are as follows:<br />
Ordinary<br />
shares<br />
Preference<br />
shares<br />
Savings<br />
shares Total<br />
2011 2010<br />
Ordinary<br />
shares<br />
Preference<br />
shares<br />
Savings<br />
shares Total<br />
Profit/(Loss) attributable to each class of<br />
shares € million 1,129 111 94 1,334 433 42 45 520<br />
Weighted average number of shares outst<strong>and</strong>ing<br />
Number of shares deployable for stock option<br />
thous<strong>and</strong> 1,054,007 103,292 79,913 1,237,212 1,053,679 103,292 79,913 1,236,884<br />
plans thous<strong>and</strong> 9,677 - - 9,677 5,936 - - 5,936<br />
Weighted average number of shares thous<strong>and</strong> 1,063,684 103,292 79.913 1,246,889 1,059,615 103,292 79,913 1,242,820<br />
Diluted Earnings/(loss) per share € 1.063 1.063 1.172 0.409 0.409 0.564


