

Fiat Group - Consolidated Financial Statements and Notes - Fiat SpA
Fiat Group - Consolidated Financial Statements and Notes - Fiat SpA
Fiat Group - Consolidated Financial Statements and Notes - Fiat SpA

You also want an ePaper? Increase the reach of your titles
YUMPU automatically turns print PDFs into web optimized ePapers that Google loves.
178<br />
<strong>Consolidated</strong><br />
<strong>Financial</strong><br />
<strong>Statements</strong><br />
at 31 December<br />
2011<br />
<strong>Notes</strong><br />
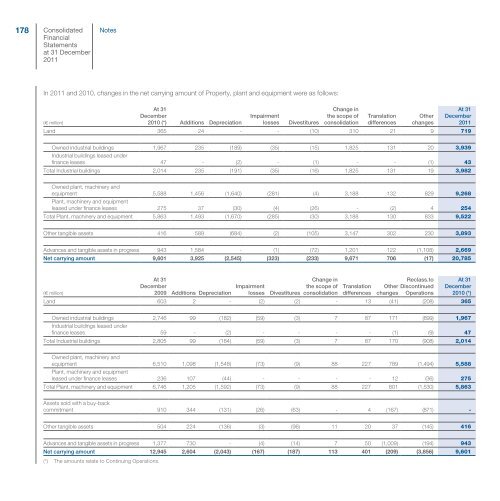
In 2011 <strong>and</strong> 2010, changes in the net carrying amount of Property, plant <strong>and</strong> equipment were as follows:<br />
(€ million)<br />
At 31<br />
December<br />
2010 (*) Additions Depreciation<br />
Impairment<br />
losses Divestitures<br />
Change in<br />
the scope of<br />
consolidation<br />
Translation<br />
differences<br />
Other<br />
changes<br />
At 31<br />
December<br />
2011<br />
L<strong>and</strong> 365 24 - - (10) 310 21 9 719<br />
Owned industrial buildings<br />
Industrial buildings leased under<br />
1,967 235 (189) (35) (15) 1,825 131 20 3,939<br />
finance leases 47 - (2) - (1) - - (1) 43<br />
Total Industrial buildings 2,014 235 (191) (35) (16) 1,825 131 19 3,982<br />
Owned plant, machinery <strong>and</strong><br />
equipment<br />
Plant, machinery <strong>and</strong> equipment<br />
5,588 1,456 (1,640) (281) (4) 3,188 132 829 9,268<br />
leased under finance leases 275 37 (30) (4) (26) - (2) 4 254<br />
Total Plant, machinery <strong>and</strong> equipment 5,863 1,493 (1,670) (285) (30) 3,188 130 833 9,522<br />
Other tangible assets 416 589 (684) (2) (105) 3,147 302 230 3,893<br />
Advances <strong>and</strong> tangible assets in progress 943 1,584 - (1) (72) 1,201 122 (1,108) 2,669<br />
Net carrying amount 9,601 3,925 (2,545) (323) (233) 9,671 706 (17) 20,785<br />
At 31<br />
Change in<br />
Reclass.to At 31<br />
December<br />
Impairment<br />
the scope of Translation Other Discontinued December<br />
(€ million)<br />
2009 Additions Depreciation losses Divestitures consolidation differences changes Operations 2010 (*)<br />
L<strong>and</strong> 603 2 - (2) (2) - 13 (41) (208) 365<br />
Owned industrial buildings<br />
Industrial buildings leased under<br />
2,746 99 (182) (59) (3) 7 87 171 (899) 1,967<br />
finance leases 59 - (2) - - - - (1) (9) 47<br />
Total Industrial buildings 2,805 99 (184) (59) (3) 7 87 170 (908) 2,014<br />
Owned plant, machinery <strong>and</strong><br />
equipment<br />
Plant, machinery <strong>and</strong> equipment<br />
6,510 1,098 (1,548) (73) (9) 88 227 789 (1,494) 5,588<br />
leased under finance leases 236 107 (44) - - - - 12 (36) 275<br />
Total Plant, machinery <strong>and</strong> equipment 6,746 1,205 (1,592) (73) (9) 88 227 801 (1,530) 5,863<br />
Assets sold with a buy-back<br />
commitment 910 344 (131) (26) (63) - 4 (167) (871) -<br />
Other tangible assets 504 224 (136) (3) (96) 11 20 37 (145) 416<br />
Advances <strong>and</strong> tangible assets in progress 1,377 730 - (4) (14) 7 50 (1,009) (194) 943<br />
Net carrying amount 12,945 2,604 (2,043) (167) (187) 113 401 (209) (3,856) 9,601<br />
(*) The amounts relate to Continuing Operations.


