

Fiat Group - Consolidated Financial Statements and Notes - Fiat SpA
Fiat Group - Consolidated Financial Statements and Notes - Fiat SpA
Fiat Group - Consolidated Financial Statements and Notes - Fiat SpA

You also want an ePaper? Increase the reach of your titles
YUMPU automatically turns print PDFs into web optimized ePapers that Google loves.
176<br />
<strong>Consolidated</strong><br />
<strong>Financial</strong><br />
<strong>Statements</strong><br />
at 31 December<br />
2011<br />
<strong>Notes</strong><br />
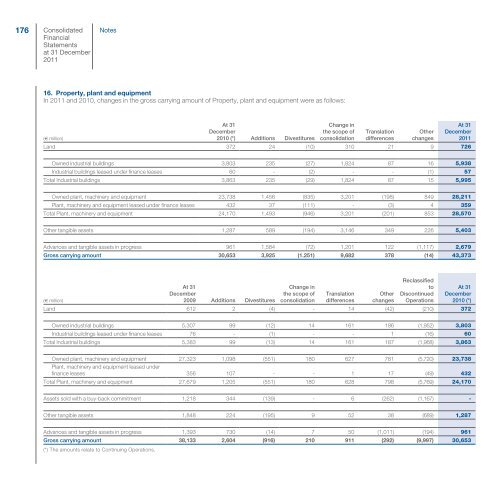
16. Property, plant <strong>and</strong> equipment<br />
In 2011 <strong>and</strong> 2010, changes in the gross carrying amount of Property, plant <strong>and</strong> equipment were as follows:<br />
(€ million)<br />
At 31<br />
December<br />
2010 (*) Additions Divestitures<br />
Change in<br />
the scope of<br />
consolidation<br />
Translation<br />
differences<br />
Other<br />
changes<br />
At 31<br />
December<br />
2011<br />
L<strong>and</strong> 372 24 (10) 310 21 9 726<br />
Owned industrial buildings 3,803 235 (27) 1,824 87 16 5,938<br />
Industrial buildings leased under finance leases 60 - (2) - - (1) 57<br />
Total Industrial buildings 3,863 235 (29) 1,824 87 15 5,995<br />
Owned plant, machinery <strong>and</strong> equipment 23,738 1,456 (835) 3,201 (198) 849 28,211<br />
Plant, machinery <strong>and</strong> equipment leased under finance leases 432 37 (111) - (3) 4 359<br />
Total Plant, machinery <strong>and</strong> equipment 24,170 1,493 (946) 3,201 (201) 853 28,570<br />
Other tangible assets 1,287 589 (194) 3,146 349 226 5,403<br />
Advances <strong>and</strong> tangible assets in progress 961 1,584 (72) 1,201 122 (1,117) 2,679<br />
Gross carrying amount 30,653 3,925 (1.251) 9,682 378 (14) 43,373<br />
(€ million)<br />
At 31<br />
December<br />
2009 Additions Divestitures<br />
Change in<br />
the scope of<br />
consolidation<br />
Translation<br />
differences<br />
Other<br />
changes<br />
Reclassified<br />
to<br />
Discontinued<br />
Operations<br />
At 31<br />
December<br />
2010 (*)<br />
L<strong>and</strong> 612 2 (4) - 14 (42) (210) 372<br />
Owned industrial buildings 5,307 99 (12) 14 161 186 (1,952) 3,803<br />
Industrial buildings leased under finance leases 76 - (1) - - 1 (16) 60<br />
Total Industrial buildings 5,383 99 (13) 14 161 187 (1,968) 3,863<br />
Owned plant, machinery <strong>and</strong> equipment<br />
Plant, machinery <strong>and</strong> equipment leased under<br />
27,323 1,098 (551) 180 627 781 (5,720) 23,738<br />
finance leases 356 107 - - 1 17 (49) 432<br />
Total Plant, machinery <strong>and</strong> equipment 27,679 1,205 (551) 180 628 798 (5,769) 24,170<br />
Assets sold with a buy-back commitment 1,218 344 (139) - 6 (262) (1,167) -<br />
Other tangible assets 1,848 224 (195) 9 52 38 (689) 1,287<br />
Advances <strong>and</strong> tangible assets in progress 1,393 730 (14) 7 50 (1,011) (194) 961<br />
Gross carrying amount<br />
(*) The amounts relate to Continuing Operations.<br />
38,133 2,604 (916) 210 911 (292) (9,997) 30,653


