Theory, Design and Tests on a Prototype Module of a Compact ...
Theory, Design and Tests on a Prototype Module of a Compact ...
Theory, Design and Tests on a Prototype Module of a Compact ...

Create successful ePaper yourself
Turn your PDF publications into a flip-book with our unique Google optimized e-Paper software.
6. THE FINAL STEPS OF THE TUNING PROCEDURE 89<br />
tank # cell type left [mm] right [mm]<br />
1 AC +3.5 +7.9<br />
CC +0.3 +7.0<br />
2 AC +6.7 +6.2<br />
CC +0.3 +7.0<br />
3 AC +5.0 +6.2<br />
CC +0.3 +7.0<br />
4 AC out +4.4<br />
CC +0.3 +7.0<br />
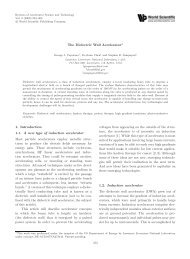
Table 5.2. tuners positi<strong>on</strong>s for the bead pulling <strong>of</strong> figure<br />
5.18.<br />
Figure 5.19. The first good bead pulling result.<br />
The figure 5.18 shows the bead pulling measurement after some<br />
interventi<strong>on</strong>s <strong>on</strong> the tuners resumed in the table 5.2. The π/2 frequency<br />
was 2996.96 MHz <str<strong>on</strong>g>and</str<strong>on</strong>g> SBB = +222 kHz.<br />
6. The final steps <strong>of</strong> the tuning procedure<br />
It is clear from the previous secti<strong>on</strong> that the tuning procedure<br />
should be made by little steps in order to be sure to keep positive<br />
the two stop-b<str<strong>on</strong>g>and</str<strong>on</strong>g>s <str<strong>on</strong>g>and</str<strong>on</strong>g> to fully underst<str<strong>on</strong>g>and</str<strong>on</strong>g> the results <strong>on</strong> the field<br />
level. Unfortunately, sometimes the interventi<strong>on</strong> <strong>on</strong> <strong>on</strong>e tank has also<br />
effect <strong>on</strong> the near tanks <str<strong>on</strong>g>and</str<strong>on</strong>g> this implies that all the interventi<strong>on</strong>s must<br />
be careful made <str<strong>on</strong>g>and</str<strong>on</strong>g> without big displacements <strong>of</strong> the tuners.<br />
The figure 5.19 shows a bead pulling measurement 14 that was quite<br />
good since the field level was flat within ±5%. The π/2 frequency was<br />
14 Note that the figure 5.19 is the output plot <strong>of</strong> the network analyzer. The<br />
scale is the same <strong>of</strong> the previous figures, the maximum being 8 divisi<strong>on</strong>s.