GaBi Paper Clip Tutorial - GaBi Software
GaBi Paper Clip Tutorial - GaBi Software
GaBi Paper Clip Tutorial - GaBi Software

Create successful ePaper yourself
Turn your PDF publications into a flip-book with our unique Google optimized e-Paper software.
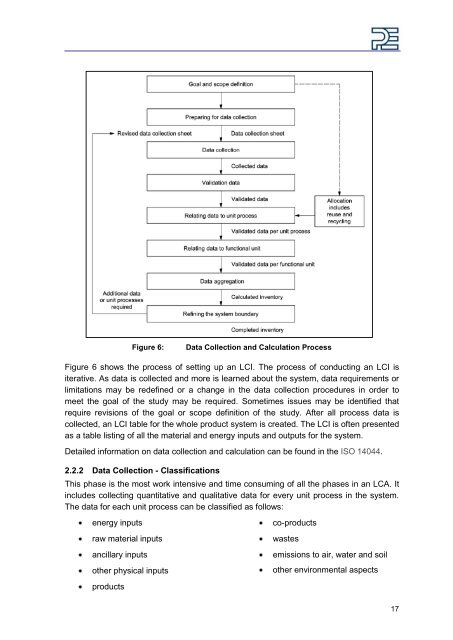
Figure 6: Data Collection and Calculation Process<br />
Figure 6 shows the process of setting up an LCI. The process of conducting an LCI is<br />
iterative. As data is collected and more is learned about the system, data requirements or<br />
limitations may be redefined or a change in the data collection procedures in order to<br />
meet the goal of the study may be required. Sometimes issues may be identified that<br />
require revisions of the goal or scope definition of the study. After all process data is<br />
collected, an LCI table for the whole product system is created. The LCI is often presented<br />
as a table listing of all the material and energy inputs and outputs for the system.<br />
Detailed information on data collection and calculation can be found in the ISO 14044.<br />
2.2.2 Data Collection - Classifications<br />
This phase is the most work intensive and time consuming of all the phases in an LCA. It<br />
includes collecting quantitative and qualitative data for every unit process in the system.<br />
The data for each unit process can be classified as follows:<br />
energy inputs<br />
raw material inputs<br />
ancillary inputs<br />
other physical inputs<br />
products<br />
co-products<br />
wastes<br />
emissions to air, water and soil<br />
other environmental aspects<br />
17