GaBi Paper Clip Tutorial - GaBi Software
GaBi Paper Clip Tutorial - GaBi Software
GaBi Paper Clip Tutorial - GaBi Software

You also want an ePaper? Increase the reach of your titles
YUMPU automatically turns print PDFs into web optimized ePapers that Google loves.
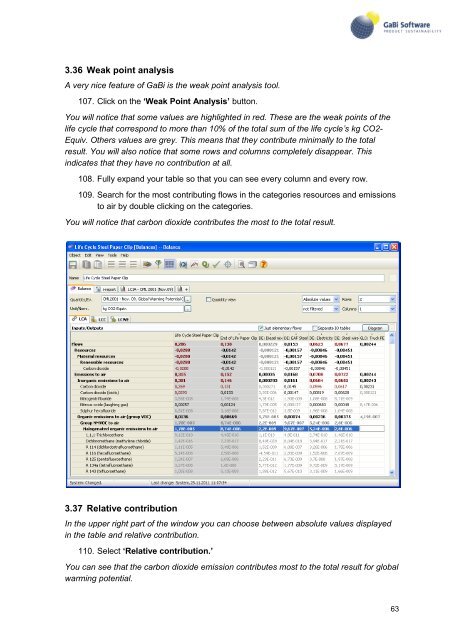
3.36 Weak point analysis<br />
A very nice feature of <strong>GaBi</strong> is the weak point analysis tool.<br />
107. Click on the „Weak Point Analysis‟ button.<br />
You will notice that some values are highlighted in red. These are the weak points of the<br />
life cycle that correspond to more than 10% of the total sum of the life cycle’s kg CO2-<br />
Equiv. Others values are grey. This means that they contribute minimally to the total<br />
result. You will also notice that some rows and columns completely disappear. This<br />
indicates that they have no contribution at all.<br />
108. Fully expand your table so that you can see every column and every row.<br />
109. Search for the most contributing flows in the categories resources and emissions<br />
to air by double clicking on the categories.<br />
You will notice that carbon dioxide contributes the most to the total result.<br />
3.37 Relative contribution<br />
In the upper right part of the window you can choose between absolute values displayed<br />
in the table and relative contribution.<br />
110. Select „Relative contribution.‟<br />
You can see that the carbon dioxide emission contributes most to the total result for global<br />
warming potential.<br />
63