Fldigi - Kambing UI
Fldigi - Kambing UI
Fldigi - Kambing UI

You also want an ePaper? Increase the reach of your titles
YUMPU automatically turns print PDFs into web optimized ePapers that Google loves.
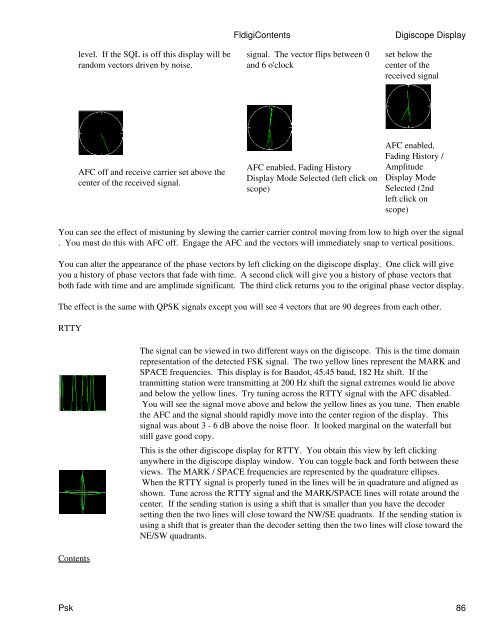
level. If the SQL is off this display will be<br />
random vectors driven by noise.<br />
AFC off and receive carrier set above the<br />
center of the received signal.<br />
signal. The vector flips between 0<br />
and 6 o'clock<br />
AFC enabled, Fading History<br />
Display Mode Selected (left click on<br />
scope)<br />
set below the<br />
center of the<br />
received signal<br />
AFC enabled,<br />
Fading History /<br />
Amplitude<br />
Display Mode<br />
Selected (2nd<br />
left click on<br />
scope)<br />
You can see the effect of mistuning by slewing the carrier carrier control moving from low to high over the signal<br />
. You must do this with AFC off. Engage the AFC and the vectors will immediately snap to vertical positions.<br />
You can alter the appearance of the phase vectors by left clicking on the digiscope display. One click will give<br />
you a history of phase vectors that fade with time. A second click will give you a history of phase vectors that<br />
both fade with time and are amplitude significant. The third click returns you to the original phase vector display.<br />
The effect is the same with QPSK signals except you will see 4 vectors that are 90 degrees from each other.<br />
RTTY<br />
Contents<br />
<strong>Fldigi</strong>Contents Digiscope Display<br />
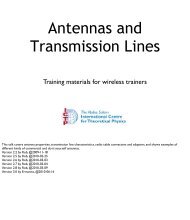
The signal can be viewed in two different ways on the digiscope. This is the time domain<br />
representation of the detected FSK signal. The two yellow lines represent the MARK and<br />
SPACE frequencies. This display is for Baudot, 45.45 baud, 182 Hz shift. If the<br />
tranmitting station were transmitting at 200 Hz shift the signal extremes would lie above<br />
and below the yellow lines. Try tuning across the RTTY signal with the AFC disabled.<br />
You will see the signal move above and below the yellow lines as you tune. Then enable<br />
the AFC and the signal should rapidly move into the center region of the display. This<br />
signal was about 3 - 6 dB above the noise floor. It looked marginal on the waterfall but<br />
still gave good copy.<br />
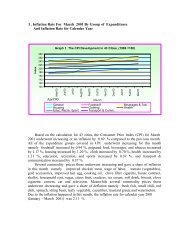
This is the other digiscope display for RTTY. You obtain this view by left clicking<br />
anywhere in the digiscope display window. You can toggle back and forth between these<br />
views. The MARK / SPACE frequencies are represented by the quadrature ellipses.<br />
When the RTTY signal is properly tuned in the lines will be in quadrature and aligned as<br />
shown. Tune across the RTTY signal and the MARK/SPACE lines will rotate around the<br />
center. If the sending station is using a shift that is smaller than you have the decoder<br />
setting then the two lines will close toward the NW/SE quadrants. If the sending station is<br />
using a shift that is greater than the decoder setting then the two lines will close toward the<br />
NE/SW quadrants.<br />
Psk 86