Proceedings - Johannes Gutenberg-Universität Mainz
Proceedings - Johannes Gutenberg-Universität Mainz
Proceedings - Johannes Gutenberg-Universität Mainz

Create successful ePaper yourself
Turn your PDF publications into a flip-book with our unique Google optimized e-Paper software.
2 nd INQUA-IGCP-567 International Workshop on Active Tectonics, Earthquake Geology, Archaeology and Engineering, Corinth, Greece (2011)<br />
EARTHQUAKE<br />
ARCHAEOLOGY<br />
INQUA PALEOSEISMOLOGY<br />
AND ACTIVE TECTONICS<br />
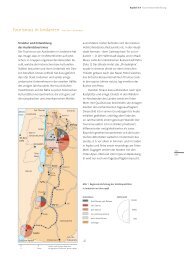
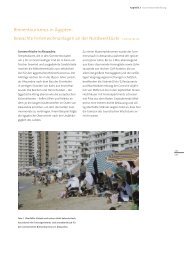
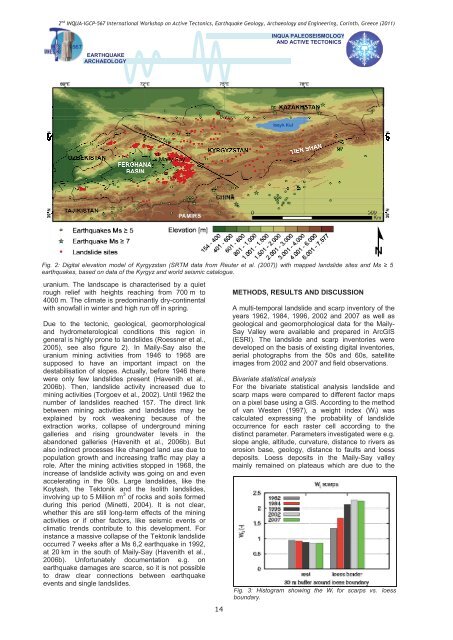
Fig. 2: Digital elevation model of Kyrgyzstan (SRTM data from Reuter et al. (2007)) with mapped landslide sites and Ms 5<br />
earthquakes, based on data of the Kyrgyz and world seismic catalogue.<br />
uranium. The landscape is characterised by a quiet<br />
rough relief with heights reaching from 700 m to<br />
4000 m. The climate is predominantly dry-continental<br />
with snowfall in winter and high run off in spring.<br />
Due to the tectonic, geological, geomorphological<br />
and hydrometerological conditions this region in<br />
general is highly prone to landslides (Roessner et al.,<br />
2005), see also figure 2). In Maily-Say also the<br />
uranium mining activities from 1946 to 1968 are<br />
supposed to have an important impact on the<br />
destabilisation of slopes. Actually, before 1946 there<br />
were only few landslides present (Havenith et al.,<br />
2006b). Then, landslide activity increased due to<br />
mining activities (Torgoev et al., 2002). Until 1962 the<br />
number of landslides reached 157. The direct link<br />
between mining activities and landslides may be<br />
explained by rock weakening because of the<br />
extraction works, collapse of underground mining<br />
galleries and rising groundwater levels in the<br />
abandoned galleries (Havenith et al., 2006b). But<br />
also indirect processes like changed land use due to<br />
population growth and increasing traffic may play a<br />
role. After the mining activities stopped in 1968, the<br />
increase of landslide activity was going on and even<br />
accelerating in the 90s. Large landslides, like the<br />
Koytash, the Tektonik and the Isolith landslides,<br />
involving up to 5 Million m 3 of rocks and soils formed<br />
during this period (Minetti, 2004). It is not clear,<br />
whether this are still long-term effects of the mining<br />
activities or if other factors, like seismic events or<br />
climatic trends contribute to this development. For<br />
instance a massive collapse of the Tektonik landslide<br />
occurred 7 weeks after a Ms 6,2 earthquake in 1992,<br />
at 20 km in the south of Maily-Say (Havenith et al.,<br />
2006b). Unfortunately documentation e.g. on<br />
earthquake damages are scarce, so it is not possible<br />
to draw clear connections between earthquake<br />
events and single landslides.<br />
14<br />
METHODS, RESULTS AND DISCUSSION<br />
A multi-temporal landslide and scarp inventory of the<br />
years 1962, 1984, 1996, 2002 and 2007 as well as<br />
geological and geomorphological data for the Maily-<br />
Say Valley were available and prepared in ArcGIS<br />
(ESRI). The landslide and scarp inventories were<br />
developed on the basis of existing digital inventories,<br />
aerial photographs from the 50s and 60s, satellite<br />
images from 2002 and 2007 and field observations.<br />
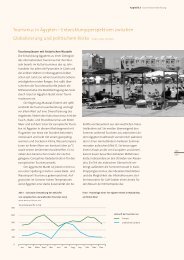
Bivariate statistical analysis<br />
For the bivariate statistical analysis landslide and<br />
scarp maps were compared to different factor maps<br />
on a pixel base using a GIS. According to the method<br />
of van Westen (1997), a weight index (W i ) was<br />
calculated expressing the probability of landslide<br />
occurrence for each raster cell according to the<br />
distinct parameter. Parameters investigated were e.g.<br />
slope angle, altitude, curvature, distance to rivers as<br />
erosion base, geology, distance to faults and loess<br />
deposits. Loess deposits in the Maily-Say valley<br />
mainly remained on plateaus which are due to the<br />
Fig. 3: Histogram showing the W i for scarps vs. loess<br />
boundary.