Performance of Special Extinguishment Agents for ... - UL.com
Performance of Special Extinguishment Agents for ... - UL.com
Performance of Special Extinguishment Agents for ... - UL.com

Create successful ePaper yourself
Turn your PDF publications into a flip-book with our unique Google optimized e-Paper software.
Issued: September 30, 2008<br />
As can be seen from Figure 33, the heat release rate reduction <strong>for</strong> the agents tested versus water<br />
as a baseline was quicker <strong>for</strong> all agents except one <strong>for</strong> the convective heat release rate.<br />
As can be seen from Figure 35, the heat release rate reduction <strong>for</strong> the agents tested versus water<br />
as a baseline was slower <strong>for</strong> all agents using the total heat release rate.<br />
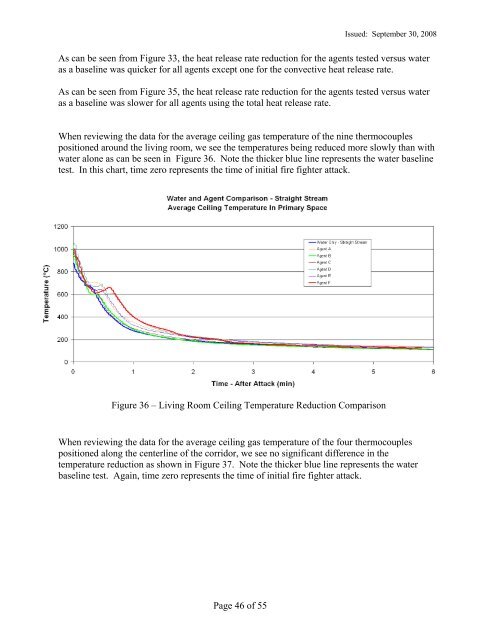
When reviewing the data <strong>for</strong> the average ceiling gas temperature <strong>of</strong> the nine thermocouples<br />
positioned around the living room, we see the temperatures being reduced more slowly than with<br />
water alone as can be seen in Figure 36. Note the thicker blue line represents the water baseline<br />
test. In this chart, time zero represents the time <strong>of</strong> initial fire fighter attack.<br />
Figure 36 – Living Room Ceiling Temperature Reduction Comparison<br />
When reviewing the data <strong>for</strong> the average ceiling gas temperature <strong>of</strong> the four thermocouples<br />
positioned along the centerline <strong>of</strong> the corridor, we see no significant difference in the<br />
temperature reduction as shown in Figure 37. Note the thicker blue line represents the water<br />
baseline test. Again, time zero represents the time <strong>of</strong> initial fire fighter attack.<br />
Page 46 <strong>of</strong> 55