2006-2007 Annual Report - Disability Services Commission
2006-2007 Annual Report - Disability Services Commission
2006-2007 Annual Report - Disability Services Commission

You also want an ePaper? Increase the reach of your titles
YUMPU automatically turns print PDFs into web optimized ePapers that Google loves.
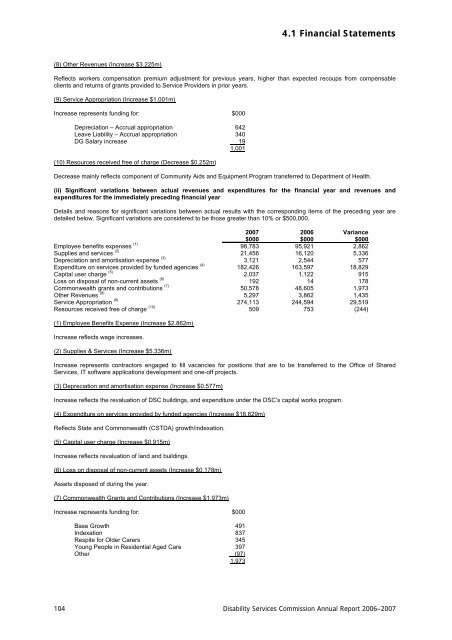
4.1 Financial Statements<br />
(8) Other Revenues (Increase $3.225m)<br />
Reflects workers compensation premium adjustment for previous years, higher than expected recoups from compensable<br />
clients and returns of grants provided to Service Providers in prior years.<br />
(9) Service Appropriation (Increase $1.001m)<br />
Increase represents funding for: $000<br />
Depreciation – Accrual appropriation 642<br />
Leave Liability – Accrual appropriation 340<br />
DG Salary increase 19<br />
1,001<br />
(10) Resources received free of charge (Decrease $0.252m)<br />
Decrease mainly reflects component of Community Aids and Equipment Program transferred to Department of Health.<br />
(ii) Significant variations between actual revenues and expenditures for the financial year and revenues and<br />
expenditures for the immediately preceding financial year<br />
Details and reasons for significant variations between actual results with the corresponding items of the preceding year are<br />
detailed below. Significant variations are considered to be those greater than 10% or $500,000.<br />
<strong>2007</strong> <strong>2006</strong> Variance<br />
_______$000 $000 $000<br />
Employee benefits expenses (1) 98,783 95,921 2,862<br />
Supplies and services (2) 21,456 16,120 5,336<br />
Depreciation and amortisation expense (3) 3,121 2,544 577<br />
Expenditure on services provided by funded agencies (4) 182,426 163,597 18,829<br />
Capital user charge (5) 2,037 1,122 915<br />
Loss on disposal of non-current assets (6) 192 14 178<br />
Commonwealth grants and contributions (7) 50,578 48,605 1,973<br />
Other Revenues (8) 5,297 3,862 1,435<br />
Service Appropriation (9) 274,113 244,594 29,519<br />
Resources received free of charge (10) 509 753 (244)<br />
(1) Employee Benefits Expense (Increase $2.862m)<br />
Increase reflects wage increases.<br />
(2) Supplies & <strong>Services</strong> (Increase $5.336m)<br />
Increase represents contractors engaged to fill vacancies for positions that are to be transferred to the Office of Shared<br />
<strong>Services</strong>, IT software applications development and one-off projects.<br />
(3) Depreciation and amortisation expense (Increase $0.577m)<br />
Increase reflects the revaluation of DSC buildings, and expenditure under the DSC’s capital works program.<br />
(4) Expenditure on services provided by funded agencies (Increase $18.829m)<br />
Reflects State and Commonwealth (CSTDA) growth/indexation.<br />
(5) Capital user charge (Increase $0.915m)<br />
Increase reflects revaluation of land and buildings.<br />
(6) Loss on disposal of non-current assets (Increase $0.178m)<br />
Assets disposed of during the year.<br />
(7) Commonwealth Grants and Contributions (Increase $1.973m)<br />
Increase represents funding for: $000<br />
Base Growth 491<br />
Indexation 837<br />
Respite for Older Carers 345<br />
Young People in Residential Aged Care 397<br />
Other (97)<br />
1,973<br />
104 <strong>Disability</strong> <strong>Services</strong> <strong>Commission</strong> <strong>Annual</strong> <strong>Report</strong> <strong>2006</strong>–<strong>2007</strong>

![Heerarka Adeegyada Naafada [PDF 102 kB] - Disability Services ...](https://img.yumpu.com/22096139/1/184x260/heerarka-adeegyada-naafada-pdf-102-kb-disability-services-.jpg?quality=85)
![معايير خدمات الإعاقة [PDF 297 kB] - Disability Services Commission](https://img.yumpu.com/22096120/1/184x260/-pdf-297-kb-disability-services-commission.jpg?quality=85)