

2006-2007 Annual Report - Disability Services Commission
2006-2007 Annual Report - Disability Services Commission
2006-2007 Annual Report - Disability Services Commission

Create successful ePaper yourself
Turn your PDF publications into a flip-book with our unique Google optimized e-Paper software.
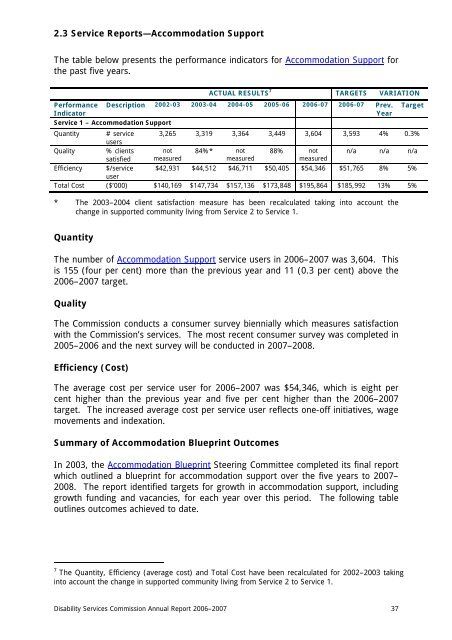
2.3 Service <strong>Report</strong>s—Accommodation Support<br />
The table below presents the performance indicators for Accommodation Support for<br />
the past five years.<br />
ACTUAL RESULTS 7 TARGETS VARIATION<br />
Performance Description 2002-03 2003-04 2004-05 2005-06 <strong>2006</strong>-07 <strong>2006</strong>-07 Prev. Target<br />
Indicator<br />
Year<br />
Service 1 – Accommodation Support<br />
Quantity # service 3,265 3,319 3,364 3,449 3,604 3,593 4% 0.3%<br />
users<br />
Quality % clients not 84%* not 88% not n/a n/a n/a<br />
satisfied measured<br />
measured<br />
measured<br />
Efficiency $/service $42,931 $44,512 $46,711 $50,405 $54,346 $51,765 8% 5%<br />
user<br />
Total Cost ($’000) $140,169 $147,734 $157,136 $173,848 $195,864 $185,992 13% 5%<br />
* The 2003–2004 client satisfaction measure has been recalculated taking into account the<br />
change in supported community living from Service 2 to Service 1.<br />
Quantity<br />
The number of Accommodation Support service users in <strong>2006</strong>–<strong>2007</strong> was 3,604. This<br />
is 155 (four per cent) more than the previous year and 11 (0.3 per cent) above the<br />
<strong>2006</strong>–<strong>2007</strong> target.<br />
Quality<br />
The <strong>Commission</strong> conducts a consumer survey biennially which measures satisfaction<br />
with the <strong>Commission</strong>’s services. The most recent consumer survey was completed in<br />
2005–<strong>2006</strong> and the next survey will be conducted in <strong>2007</strong>–2008.<br />
Efficiency (Cost)<br />
The average cost per service user for <strong>2006</strong>–<strong>2007</strong> was $54,346, which is eight per<br />
cent higher than the previous year and five per cent higher than the <strong>2006</strong>–<strong>2007</strong><br />
target. The increased average cost per service user reflects one-off initiatives, wage<br />
movements and indexation.<br />
Summary of Accommodation Blueprint Outcomes<br />
In 2003, the Accommodation Blueprint Steering Committee completed its final report<br />
which outlined a blueprint for accommodation support over the five years to <strong>2007</strong>–<br />
2008. The report identified targets for growth in accommodation support, including<br />
growth funding and vacancies, for each year over this period. The following table<br />
outlines outcomes achieved to date.<br />
7 The Quantity, Efficiency (average cost) and Total Cost have been recalculated for 2002–2003 taking<br />
into account the change in supported community living from Service 2 to Service 1.<br />
<strong>Disability</strong> <strong>Services</strong> <strong>Commission</strong> <strong>Annual</strong> <strong>Report</strong> <strong>2006</strong>–<strong>2007</strong> 37


![Heerarka Adeegyada Naafada [PDF 102 kB] - Disability Services ...](https://img.yumpu.com/22096139/1/184x260/heerarka-adeegyada-naafada-pdf-102-kb-disability-services-.jpg?quality=85)

![معايير خدمات الإعاقة [PDF 297 kB] - Disability Services Commission](https://img.yumpu.com/22096120/1/184x260/-pdf-297-kb-disability-services-commission.jpg?quality=85)