

2006-2007 Annual Report - Disability Services Commission
2006-2007 Annual Report - Disability Services Commission
2006-2007 Annual Report - Disability Services Commission

You also want an ePaper? Increase the reach of your titles
YUMPU automatically turns print PDFs into web optimized ePapers that Google loves.
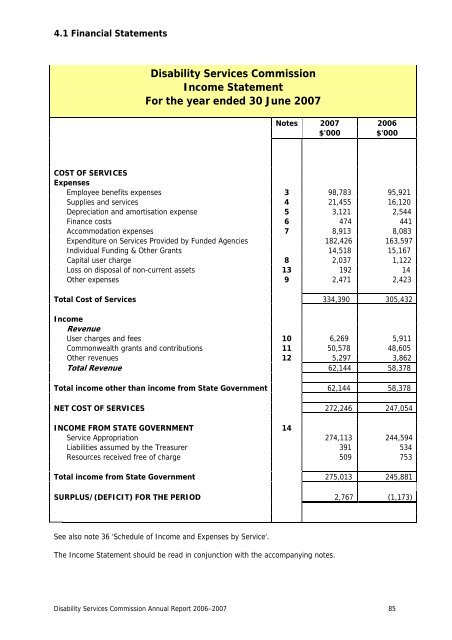
4.1 Financial Statements<br />
<strong>Disability</strong> <strong>Services</strong> <strong>Commission</strong><br />
Income Statement<br />
For the year ended 30 June <strong>2007</strong><br />
Notes <strong>2007</strong> <strong>2006</strong><br />
$'000 $'000<br />
COST OF SERVICES<br />
Expenses<br />
Employee benefits expenses 3 98,783 95,921<br />
Supplies and services 4 21,455 16,120<br />
Depreciation and amortisation expense 5 3,121 2,544<br />
Finance costs 6 474 441<br />
Accommodation expenses 7 8,913 8,083<br />
Expenditure on <strong>Services</strong> Provided by Funded Agencies 182,426 163,597<br />
Individual Funding & Other Grants 14,518 15,167<br />
Capital user charge 8 2,037 1,122<br />
Loss on disposal of non-current assets 13 192 14<br />
Other expenses 9 2,471 2,423<br />
Total Cost of <strong>Services</strong> 334,390 305,432<br />
Income<br />
Revenue<br />
User charges and fees 10 6,269 5,911<br />
Commonwealth grants and contributions 11 50,578 48,605<br />
Other revenues 12 5,297 3,862<br />
Total Revenue 62,144 58,378<br />
Total income other than income from State Government 62,144 58,378<br />
NET COST OF SERVICES 272,246 247,054<br />
INCOME FROM STATE GOVERNMENT 14<br />
Service Appropriation 274,113 244,594<br />
Liabilities assumed by the Treasurer 391 534<br />
Resources received free of charge 509 753<br />
Total income from State Government 275,013 245,881<br />
SURPLUS/(DEFICIT) FOR THE PERIOD 2,767 (1,173)<br />
See also note 36 'Schedule of Income and Expenses by Service'.<br />
The Income Statement should be read in conjunction with the accompanying notes.<br />
<strong>Disability</strong> <strong>Services</strong> <strong>Commission</strong> <strong>Annual</strong> <strong>Report</strong> <strong>2006</strong>–<strong>2007</strong> 85

![Heerarka Adeegyada Naafada [PDF 102 kB] - Disability Services ...](https://img.yumpu.com/22096139/1/184x260/heerarka-adeegyada-naafada-pdf-102-kb-disability-services-.jpg?quality=85)

![معايير خدمات الإعاقة [PDF 297 kB] - Disability Services Commission](https://img.yumpu.com/22096120/1/184x260/-pdf-297-kb-disability-services-commission.jpg?quality=85)