NUMERICAL SIMULATION OF LOW-SPEED STALL AND ... - IAG
NUMERICAL SIMULATION OF LOW-SPEED STALL AND ... - IAG
NUMERICAL SIMULATION OF LOW-SPEED STALL AND ... - IAG

Create successful ePaper yourself
Turn your PDF publications into a flip-book with our unique Google optimized e-Paper software.
Conference on Modelling Fluid Flow (CMFF’12)<br />
The 15 th International Conference on Fluid Flow Technologies<br />
Budapest, Hungary, September 4-7, 2012<br />
<strong>NUMERICAL</strong> <strong>SIMULATION</strong> <strong>OF</strong> <strong>LOW</strong>-<strong>SPEED</strong> <strong>STALL</strong> <strong>AND</strong> ANALYSIS <strong>OF</strong><br />
TURBULENT WAKE SPECTRA<br />
Philipp Peter GANSEL 1 , Sebastian ILLI 2 , Thorsten LUTZ 3 , Ewald KRÄMER 4<br />
1 Corresponding Author. Institute of Aerodynamics and Gas Dynamics, University of Stuttgart. Pfaffenwaldring 21, 70569 Stuttgart, Germany.<br />
Tel.: +49 711 685 63416, Fax: +49 711 685 63438, E-mail: gansel@iag.uni-stuttgart.de<br />
2 E-mail: illi@iag.uni-stuttgart.de<br />
3 Head of branch “Aircraft aerodynamics“. E-mail: lutz@iag.uni-stuttgart.de<br />
4 Head of Institute. E-mail: kraemer@iag.uni-stuttgart.de<br />
ABSTRACT<br />
At the Institute of Aerodynamics and Gas<br />
Dynamics (<strong>IAG</strong>) numerical studies on the low-speed<br />
stall of aircraft wings, the development of the wake<br />
and its interaction with the empennage are performed.<br />
In the present paper unsteady Reynolds-averaged<br />
Navier-Stokes (URANS) calculations as well as highly<br />
resolved Delayed Detached-Eddy Simulations (DDES)<br />
of the turbulent wake downstream of a boundary<br />
layer separation on an airfoil section are described.<br />
For these simulations a NACA 0012 airfoil test case<br />
with a free stream Mach number of 0.3 and a<br />
Reynolds number of 6 million at a high angle of<br />
attack was chosen. URANS calculations on different<br />
grids and with different turbulence models show that<br />
a fine structured discretisation of the wake region<br />
facilitates the transport of turbulent viscosity with low<br />
dissipation. The DDES approach allows propagation<br />
of resolved turbulent structures far downstream of<br />
the flow separation. The spectral analysis shows a<br />
good agreement of measured and simulated pressure<br />
fluctuations in the junction of energy-containing range<br />
and inertial sub-range of the spectrum. Furthermore<br />
semi-empirical turbulence spectrum models were<br />
used to obtain spectral turbulence information from<br />
URANS solutions. The resulting turbulent velocity<br />
fluctuation spectra are compared to the resolved<br />
velocity fluctuations of the DDES.<br />
Keywords: CFD, DDES, stall, spectra, wake<br />
NOMENCLATURE<br />
E 11 [m 3 /s 2 ] one-dimensional longitudinal<br />
turbulent kinetic energy spectrum<br />
F+ [−] reduced frequency<br />
L 11 [m] longitudinal integral length scale<br />
Ma [−] Mach number<br />
R 11 [m 2 /s 2 ] spatial velocity autocorrelation<br />
Re [−] chord Reynolds number<br />
U ∞ [m/s] free stream velocity<br />
c [m] airfoil chord length<br />
c l [−] lift coefficient<br />
c p [−] static pressure coefficient<br />
k [m 2 /s 2 ] specific turbulent kinetic energy<br />
r [m] distance<br />
t [s] time<br />
u [m/s] velocity inx-direction<br />
x, y,z [m] space coordinates<br />
y 1 + [-] dimensionless wall coordinate<br />
α [ ◦ ] angle of attack<br />
∆ [m] maximal cell edge length<br />
in the structured wake mesh<br />
ε [m 2 /s 3 ] dissipation rate ofk<br />
κ 1 [1/m] longitudinal wave number<br />
κ e [1/m] wave number of the most<br />
energy containing eddies<br />
ω [1/s] turbulent dissipation frequency<br />
Subscripts and Superscripts<br />
¯ temporal mean<br />
′<br />
fluctuation<br />
1. INTRODUCTION<br />
At the boarders of the flight envelope flow effects<br />
occur which still are not completely understood and far<br />
from being reproduced correctly by today’s numerical<br />
methods in industry relevant flow cases. At low Mach<br />
numbers and sufficiently high angles of attack large<br />
boundary layer separations on the wing cause a rapid<br />
lift drop and form a highly unsteady turbulent wake.<br />
This phenomenon called low-speed stall is the subject<br />
of the presented studies, with a focus on the spectral<br />
information in the wake downstream of the separation.<br />
The fluctuations can affect the inflow conditions and<br />
the flow state of the safety critical horizontal tail plane<br />
(htp) [1] or even excite its structural modes.<br />
However, only few published studies concerning<br />
transport aircraft configurations deal with turbulent<br />
fluctuations in the wake. Whitney et al. [2] developed<br />
199
an URANS based model to predict htp yaw and roll<br />
moment fluctuations measured near low-speed stall.<br />
In the German HINVA research project in-flight stall<br />
tests with the DLR ATRA aircraft are planned to<br />
collect amongst others unsteady pressure signatures<br />
on wing and htp as a validation basis for unsteady<br />
CFD methods [3]. A couple of investigations of<br />
turbulent wake fluctuations have been published in<br />
the context of active flow control devices. Seifert<br />
and Pack [4] evaluated the spectral content of the<br />
turbulent wake of a stalling airfoil with and without<br />
periodic blowing near the leading edge by means<br />
of unsteady pressure transducers. Wokoeck et<br />
al. [5] used PIV measurements of a stalling tail<br />
plane airfoil to validate RANS results with different<br />
transition prediction methods. Lopez Mejia et al.<br />
[6] explored time-averaged and instantaneous vorticity<br />
fields around an airfoil with tangentially aligned<br />
synthetic jet actuators using an incompressible DDES<br />
code (EDDES) and PIV measurements. Since hybrid<br />
RANS-LES methods as DES were developed to model<br />
massive separation, at first applications concentrated<br />
on flows around blunt bodies or airfoils in deep stall<br />
[7–9]. Beyond that, Onera performed zonal and<br />
delayed DES on three-element airfoils [10–12] and<br />
on a civil aircraft type configuration [13]. Nagy<br />
et al. [14] conducted zonal RANS-LES and LDA<br />
measurements of a fan airfoil with intent to calculate<br />
the flow generated noise. In their numerical studies<br />
Durrani and Qin [15] compared Reynolds stresses in<br />
the boundary layer and the near wake region of an<br />
airfoil from DDES, DES, URANS and experiments.<br />
Probst and Radespiel [16] applied different DES<br />
approaches and showed deficiencies in the prediction<br />
of mild trailing edge separation. Stall of a NACA<br />
0012 airfoil was investigated by Lehmkuhl et al. [17]<br />
by comparing Direct Numerical Simulation and Large<br />
Eddy Simulation (LES) results.<br />
In the presented research three different ways to<br />
assess the spectrum of turbulent motions in separated<br />
airfoil flow are tested and compared: unsteady RANS<br />
calculations with evaluation of the resolved large<br />
scale fluctuations of the flow variables, DDES with<br />
fine resolution of turbulent fluctuations down to the<br />
dissipation range and a tubulence spectrum model<br />
based on URANS turbulence model entities.<br />
2. FUNDAMENTALS<br />
2.1. Turbulent Spectrum Model<br />
Proccesses in turbulent flows at high Reynolds<br />
numbers can be described by the concept of the energy<br />
cascade [18]. It states that turbulence consists of eddies<br />
of different sizes. Energy is entered into turbulence at<br />
large scales driven by the boundary conditions given as<br />
the adjacent flow field, then transferred to successively<br />
smaller eddies and finally dissipated to heat at the<br />
smallest scale, called the Kolmogorov scale. The so<br />
called Kolmogorov hypotheses state that at high Re<br />
i) small scale turbulence is locally isotropic, ii) the<br />
statistics of turbulent motions are of universal form<br />
and uniquely determined by turbulent dissipation rate<br />
ε and viscosity and iii) in a certain range of scale<br />
the statistics of turbulent motions are independent<br />
of viscosity as well and thus solely defined by ε.<br />
Accordingly the turbulent spectrum can be devided<br />
into the energy-containing range, where big eddies are<br />
formed and depend on the flow conditions, the inertial<br />
subrange, where energy is passed on to smaller scales<br />
by inviscid processes and the dissipation range where<br />
viscous effects dominate. The universal functional<br />
form of the turbulent spetrum allows to construct<br />
models independent of the particular class of flow.<br />
Von Kármán developed a turbulent energy spectrum<br />
model, wherefrom Lysack and Brungart [19] derived<br />
the one-dimensional longitudinal spectrum<br />
E 11 (κ 1 ) = 8.73<br />
55<br />
[<br />
k<br />
κ e<br />
(<br />
κ1<br />
1+<br />
κ e<br />
) 2<br />
] 5/6<br />
(1)<br />
with the most energy containing eddies’ wave number<br />
κ e = 1.9 ε<br />
k 3/2 (2)<br />
and the turbulent kinetic energy k. When derived<br />
from a time and space dependent data sample,E 11 (κ 1 )<br />
equals twice the Fourier transform of the velocity<br />
fluctuation two-point auto-correlation<br />
R 11 (r,t) = u ′ (x+r,t)·u ′ (x,t) . (3)<br />
2.2. Numerical Methods<br />
The calculation of the fluid flow describing<br />
incompressible Navier-Stokes equations for industry<br />
relevant cases with complex geometries and high<br />
Reynolds numbers today is still not affordable, since<br />
the number of grid points required for sufficient<br />
resolution and the CPU-time needed for computation<br />
are proportional to Re 9/4 and Re 3 respectively [20].<br />
One approach is to decompose the flow variables in the<br />
Navier-Stokes equations into a temporal mean value<br />
and a time-dependent fluctuation. This leads to the<br />
RANS equations which are solved for the mean values.<br />
The remaining fluctuation-dependent terms (called<br />
Reynolds stresses) are modelled. To determinate the<br />
Reynolds stresses eddy viscosity turbulence models<br />
are widely used. For the URANS simulations<br />
conducted in the presented studies mainly the Menter<br />
SST two-equation turbulence [21] model was used.<br />
It provides transport equations for k and either its<br />
dissipation rate ε (in the free flow) or the dissipation<br />
frequency ω = ε/k (in near wall flow).<br />
If turbulent fluctuations shall be resolved in the<br />
simulations RANS methods are not applicable by<br />
definition. DES became popular for flows with large<br />
scale boundary layer separation in the recent years.<br />
200
It combines the advantage of LES to resolve the big<br />
turbulent structures with relatively small grid sizes.<br />
The outer part of the separated flow is calculated with<br />
LES, where the total grid points scale with Re 0.4<br />
[20]. In the boundary layer, where LES would require<br />
much more cells, RANS equations are applied. In<br />
contrast to RANS, in LES the Navier-Stokes equations<br />
are not averaged in time but spatially filtered, where<br />
the filter width is proportional to the biggest cell<br />
extension. In the equations terms depending on the<br />
residual fluctuations filtered out remain according to<br />
the Reynolds stresses in RANS and are named residual<br />
or subgrid scale (SGS) stresses. Again they can be<br />
modelled using eddy viscosity models, of which the<br />
Smagorinsky model is used in the present study.<br />
Spalart et al. [22] presented an implementation of<br />
DDES where the SA turbulence model is used in the<br />
RANS domain and the SGS model is formulated in<br />
such a way that the transport equation can be transfered<br />
into the SA model equation by replacing the local<br />
grid size by the distance to the nearest wall. A flow<br />
dependent blending function controls the application<br />
of the different approaches. Nevertheless the adequate<br />
selection of the required spatial grid resolution is<br />
crucial for correct operation of the hybrid scheme.<br />
3. CONDUCTED <strong>SIMULATION</strong>S<br />
3.1. Test Case Description<br />
As a test case wind tunnel tests were chosen<br />
from literature with available unsteady measurements<br />
in the wake [4]. The analysed NACA 0012 airfoil<br />
section with a chord length c of 0.165m was tested<br />
in a transonic cryogenic wind tunnel under free stream<br />
conditions of Ma = 0.3 and Re = 6·10 6 . The data<br />
chosen for the presented simulations were recorded at<br />
an angle of attack of α = 16 ◦ , where a big turbulent<br />
separation area occurs on the airfoil.<br />
Due to the high memory consumption of full flow<br />
field solutions, the spectral analysis, which all time<br />
steps are required for, was conducted only in three<br />
defined points listed in Table 1. Position A is very close<br />
to the trailing edge and position B lies approximately<br />
in the middle of the wake at a downstream position.<br />
In the experiments unsteady pressure transducers were<br />
placed in the wake at position C. The origin of the used<br />
coordinate system is placed at the airfoil leading edge,<br />
the x-axis points towards the trailing edge, the y-axis<br />
in span wise direction and thez-axis upwards.<br />
Table 1. Analysed measurement positions<br />
Position A B C<br />
x/c 1.2121 3.3750 3.3750<br />
z/c 0.12121 0.60606 1.2198<br />
3.2. Numerical Setup<br />
The presented simulations have been performed<br />
using the unstructured finite volume code TAU (version<br />
2011.1.0) from DLR (German Aerospace Center) [23].<br />
It can handle the mixed-type element hybrid meshes<br />
created with the meshing software Gridgen V15.17.<br />
For the URANS calculations the computational<br />
domain is a two-dimensional (2d) hybrid mesh with<br />
a C-type boundary layer mesh, a big structured wake<br />
area and an unstructured farfield region. The boundary<br />
layer grids of the three resolution levels fine, medium<br />
and coarse have 60 cells in wall normal direction with<br />
a first cell size of y 1 + ≤ 1 independently of the grid<br />
resolution. The wake mesh is directly attached to the<br />
boundary layer mesh with a smooth transition of cell<br />
size. Table 2 shows cell sizes in the homogeneously<br />
structured wake region, overall and surface point<br />
counts for the different grid resolutions. To save<br />
computational costs, the wake mesh is restricted to the<br />
part of the flow field, where the measurement positions<br />
are defined and the turbulent wake is assumed to pass<br />
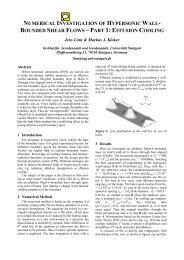
through (Figure 1). The farfield boundary distance<br />
from the airfoil geometry is 100c.<br />
Table 2. Point counts and wake region cell size ∆ of<br />
the used RANS and DES meshes<br />
RANS<br />
DES<br />
fine medium coarse<br />
points 219000 94000 47000 17.8·10 6<br />
surf. pts. 445 243 139 445×81<br />
∆ 0.5%c 1.0%c 2.0%c 0.5%c<br />
U ∞<br />
unstructured<br />
tetrahedral mesh<br />
A<br />
structured<br />
hexahedral mesh<br />
Figure 1. Computational domain with the analysed<br />
measurement positions A, B and C<br />
In the URANS simulations the second order<br />
Jameson central discretisation scheme was used with<br />
matrix dissipation for stabilisation. The dual time<br />
stepping method was applied with a physical time<br />
step size of 25µs which is approximately 1/100 times<br />
the convective time scale c/U ∞ . Amongst others<br />
the one equation turbulence model from Spalart and<br />
Allmaras [24] in its original formulation (SAO), the<br />
shear stress transport model (SST) from Menter [21]<br />
and the Reynolds stress model (RSM) implemented in<br />
TAU [23] were used as turbulence models. For DDES<br />
calculations the structured parts of the fine 2d URANS<br />
mesh were extruded span wise by 40%c with the same<br />
cell size ∆ in y-direction yielding three-dimensional<br />
(3d) isotropic structured cells in the wake region. The<br />
farfield mesh is filled up with tetrahedra. On the<br />
span wise boundary planes periodic conditions were<br />
C<br />
B<br />
201
applied to simulate an infinite wing without any tip or<br />
wind tunnel side wall effects. The distance between<br />
the periodic planes was chosen as big as possible<br />
under consideration of limited computational costs to<br />
minimise the error introduced through the forced span<br />
wise periodicity of the flow. The numerical schemes<br />
were the same as applied to URANS. During one time<br />
step of 2.5µs the flow passes the shortest cells in<br />
the wake which, in combination with the isotropically<br />
structured mesh, ensures a low dissipation in the<br />
propagation of the turbulent wake structures.<br />
4. RESULTS<br />
4.1. URANS Simulations<br />
The analysis of the 2d URANS simulations<br />
concentrates on the SST turbulence model because<br />
it is used for the semi-empirical turbulent fluctuation<br />
spectrum model later. The results with the other<br />
eddy-viscosity turbulence models are comparable. In<br />
the simulations the boundary layer flow separates from<br />
the suction side of the airfoil, as expected from the<br />
compared experimental data. The unsteady flow is<br />
exactly periodic with a very long main cycle of about<br />
11.5 convective time scales (see Figure 2). Over a<br />
big part of this period the separated flow reattaches to<br />
the upper surface of the airfoil and forms a separation<br />
bubble (see Figure 3 a)). Gradually the separation point<br />
is moving upstream and the vortex inside the bubble is<br />
getting stronger. This becomes significant in the rising<br />
lift coefficient during this phase. There is virtually no<br />
large-scale turbulent movement in the wake.<br />
1.6<br />
1.4<br />
c l<br />
1.2<br />
1<br />
0.8<br />
0 5 10 15 20 25 30 35 40<br />
t U c ∞<br />
Figure 2. c l time series of a NACA 0012 airfoil at<br />
16 ◦ angle of attack (URANS SST)<br />
At one moment a counter rotating vortex develops<br />
behind the separation bubble and a shedding process<br />
begins which means a drastic decrease of lift (see<br />
Fig. 2). The streamlines in Fig. 3 b) show the flow<br />
state shortly after this event. Finally several alternately<br />
rotating vortices are shed from the airfoil, the flow<br />
reattaches in the upstream part due to the reduced<br />
circulation and the remaining small separation bubble<br />
starts again to grow and increase the lift (see Fig. 3 c)).<br />
The time-averaged pressure distribution on the<br />
airfoil simulated with the three different turbulence<br />
models is compared to experimental data in Figure 4.<br />
The numerical results lie very close to each other.<br />
However, the measurements of Seifert and Pack [4] are<br />
qualitatively different. In contrast to the simulations<br />
a)<br />
b)<br />
c)<br />
Figure 3. Instantaneous streamlines at a) t U∞ c<br />
=<br />
14.5, b) 17.5 and c) 19 as highlighted with◦in Fig. 2<br />
the airfoil flow is separated over the whole chord<br />
length which is expressed in the lower pressure in<br />
the rear part of the airfoil. The drop of circulation<br />
causes a decrease of the leading edge suction peak<br />
and overall lift level. Yet there are older wind tunnel<br />
tests conducted by Ladson et al. [25] in the same<br />
facility that fit the simulations very good. This leads<br />
to the assumption that the test case is exactly at the<br />
boarder between those two flow patterns and little<br />
disturbances can determine it. Since it is known<br />
that eddy-viscosity turbulence models tend to predict<br />
boundary layer separation too late in the sense of<br />
higher incidence, some calculations at increased α<br />
were accomplished. The surface pressure distribution<br />
at α = 18.5 ◦ was found to be in very good agreement<br />
with the experiment of Seifert and Pack (see Fig. 4).<br />
-6<br />
-5<br />
-4<br />
c<br />
-3<br />
p<br />
-2<br />
-1<br />
0<br />
1<br />
16° Exp. Seifert<br />
16° Exp. Ladson<br />
16° C-grid URANS SAO<br />
16° C-grid URANS SST<br />
16° C-grid URANS RSM<br />
18.5° C-grid URANS SST<br />
0 0.2 0.4 0.6 0.8 1<br />
x/c<br />
Figure 4. Fine grid URANS mean pressure<br />
distributions compared to experimental data<br />
In the comparison of the pressure distribution<br />
simulated on the different grids (Figure 5) it can be<br />
202
seen that with increasing spatial resolution the pressure<br />
on the suction side in front of about 25%c is increasing<br />
a bit, but decreasing behind that point. On the pressure<br />
side there are no noticeable differences.<br />
-6<br />
-5<br />
-4<br />
-3<br />
c p<br />
-2<br />
-1<br />
0<br />
1<br />
Exp. Ladson<br />
SST ∆ = 0.5% c<br />
SST ∆ = 1.0% c<br />
SST ∆ = 2.0% c<br />
0 0.2 0.4 0.6 0.8 1<br />
x/c<br />
Figure 5. URANS meanc p with diff. resolutions<br />
The resolved pressure fluctuation spectra at<br />
position C in the simulation on the fine and medium<br />
grids are dominated by the main flow oscillation seen<br />
above in the lift characteristics and its higher harmonics<br />
(see Figure 6). The bad results on the coarse mesh<br />
can be explained with high numerical dissipation of the<br />
fluctuations in the insufficiently resolved wake mesh,<br />
since the pressure distributions on the airfoil surface<br />
are almost equal for all URANS grids. The medium<br />
grid simulation seems to match the experimental data<br />
in its peaks, but in terms of grid convergence the<br />
peaks of the fine mesh simulations overestimate the<br />
amplitudes. Compared to the URANS calculations<br />
the experiment shows a smoother spectrum without<br />
harmonic peaks. This fact suggests a more continuous<br />
vortex shedding progress in the experiment than the<br />
URANS simulations show.<br />
c p<br />
’<br />
Position C<br />
Exp. Seifert<br />
10 -1 x = 3.375c<br />
SST ∆ = 0.5%c<br />
z = 1.220c<br />
SST ∆ = 1.0%c<br />
SST ∆ = 2.0%c<br />
10 -3<br />
10 -5<br />
10 -7<br />
10 -9<br />
10 -11<br />
10 -1 10<br />
F+<br />
0 10 1<br />
Figure 6. Pressure fluctuations resolved by URANS<br />
on fine, medium and coarse meshes<br />
4.2. DDES Calculations<br />
The DDES calculation produces a physically more<br />
reasonable flow pattern with continuously shed vortices<br />
of different scales. The 3d vortices can be visualised<br />
using the λ 2 criterion as illustrated in Figure 7. It is<br />
evident that the fine turbulent structures dissipate as<br />
soon as they leave the structured wake mesh and enter<br />
the coarser areas of the tetrahedra.<br />
Figure 7. λ 2 iso-surface of turbulenct wake (DDES)<br />
The time-averagedc p distribution from the DDES<br />
shows an earlier and more clearly visible separation<br />
point (see Figure 8) than the URANS. It is<br />
remarkable that even the RANS simulation with the<br />
SAO turbulence model produces a different pressure<br />
distribution than DDES, where in the boundary layer<br />
enclosing RANS area the same turbulence model is<br />
used. This shows the feedback of the separated flow<br />
on the boundary layer state.<br />
-6<br />
-5<br />
-4<br />
-3<br />
c p<br />
-2<br />
-1<br />
0<br />
1<br />
Exp. Ladson<br />
SAO DDES<br />
URANS SST<br />
URANS SAO<br />
0 0.2 0.4 0.6 0.8 1<br />
x/c<br />
Figure 8. DDES span wise averaged mean c p<br />
compared to URANS and experiment<br />
To give a better insight in the differences of<br />
URANS and DDES simulated flow, the instantaneous<br />
vorticity in a x-z plane is plotted in Figure 9 (for the<br />
URANS plot the same time step was chosen as shown<br />
in Fig. 3 c)). While the URANS results show few<br />
big discrete vortices the DDES generates structures of<br />
different sizes. Furthermore small vortex cores of high<br />
vorticity are preserved longer.<br />
The pressure fluctuation spectrum derived from<br />
DDES time series at position C is in good agreement<br />
with the measurement data (see Figure 10). The<br />
spectrum has no outstanding peaks like the URANS<br />
spectrum in Fig. 6 which confirms the assumption<br />
about the character of the DDES calculated flow.<br />
The spectra derived at positions A and B are plotted<br />
additionally in Fig. 10. The spectrum at position A<br />
shows the highest amplitudes due to its proximity to<br />
the airfoil trailing edge where the shedding turbulent<br />
203
medium mesh results in Fig. 6) the same characteristics<br />
are expected as with the fine DDES mesh. According<br />
studies also discussing different DES formulations are<br />
to be published by Illi et al. [26].<br />
Another approach to gain information about the<br />
turbulent spectrum is to perform the relatively cheap<br />
URANS and model a turbulence spectrum from the<br />
turbulent quantities calculated by the turbulence model.<br />
This is done for the presented test case in the following<br />
section.<br />
Figure 9. Vorticity in x-z plane from URANS SST<br />
(upper picture) and DDES (lower picture)<br />
vortices are formed driven by the boundary conditions.<br />
In position B the fluctuation level is already about one<br />
order of magnitude smaller because of the decaying<br />
processes in the energy cascade and the spreading of<br />
the wake while propagated downstream. In point C the<br />
amplitudes are even smaller, although in this position<br />
the flow has passed roughly the same distance from<br />
the airfoil as in point B. However, point C lies close to<br />
the boarder of the wake to the outer free stream region<br />
where the turbulence intensity is significant lower.<br />
10 -3<br />
4.3. Modelled Fluctuation Spectra<br />
For an applicability assessment of the velocity<br />
spectrum model presented by Lysack and Brungart<br />
[19] for separated wake flow first the turbulent kinetic<br />
energy k and its dissipation range ε were extracted<br />
from URANS solutions. For comparison k = 0.5 ·<br />
(u ′2 + v ′2 + w ′2 ) also has been calculated from the<br />
DDES results and listed in Table 3. Here the amount of<br />
turbulence modelled by the SGS model is neglected.<br />
Table 3. Time-averaged turbulent kinetic energy k<br />
from URANS SST and DDES<br />
k [m 2 /s 2 ] pos. A pos. B pos. C<br />
DDES 678.28 43.670 0.041669<br />
URANS fine 264.90 49.921 6.3069<br />
URANS medium 301.34 44.718 0.33582<br />
URANS coarse 398.00 46.848 0.00047421<br />
10 -2 Exp. Seifert Pos. C<br />
c’ p<br />
10 -4<br />
10 -5<br />
10 -6<br />
10 -7<br />
DDES ∆ = 0.5%c Pos. A<br />
DDES ∆ = 0.5%c Pos. B<br />
DDES ∆ = 0.5%c Pos. C<br />
10 -1 10 0 10<br />
F+<br />
1 10 2<br />
Figure 10. Pressure fluctuations resolved by DDES<br />
in wake positions A, B and C<br />
It should be noted in this place that the simulated<br />
physical time covered by the DDES calculation is<br />
much shorter than in the URANS cases. A total of<br />
6000 physical time steps with 200 inner iterations each<br />
were computed within the DDES on 500 computing<br />
cores in parallel mode. The last 2000 time steps<br />
were considered for spectral analysis after the time<br />
averaged flow quantities have reached convergence.<br />
Due to the big grid, the small time step size<br />
and limited computational resources the spectrum is<br />
limited to relatively high frequencies, since the lowest<br />
representable frequency is reciprocally proportional to<br />
the total time length of the evaluated signal.<br />
One possibility to overcome this problem without<br />
adding computational time is to perform the DDES<br />
on a coarser mesh with less points and thus bigger<br />
time steps. Like shown for URANS (compare fine and<br />
The values show that close to the trailing edge<br />
(position A) the URANS simulations give a much<br />
lower turbulence level than the DDES. Additionally<br />
k is increasing with decreasing spatial resolution. At<br />
position B in the middle of the wake downstream<br />
of the airfoil k is very comparable for all presented<br />
simulations. At the boarder of the turbulent wake<br />
in point C k is very low and the relative differences<br />
between the methods and grid resolutions are in the<br />
range of several orders of magnitude.<br />
Utilising Taylor’s hypothesis of frozen turbulence<br />
the time dependent velocity data logged at A, B and C<br />
during the DDES calculation can be transferred into a<br />
space domain [18]. The one-dimensional longitudinal<br />
velocity spectra E 11 (κ 1 ) from DDES are derived by<br />
duplicating and Fourier transformingR 11 (Eq. (3)). For<br />
URANS E 11 (κ 1 ) is calculated via Eq. (1).<br />
In Figure 11 E 11 (κ 1 ) at the different evaluation<br />
positions is plotted. As seen from the turbulent kinetic<br />
energy in Table 3 the modelled spectra in point A<br />
underpredict the DDES calculated amplitudes. At<br />
position B in the middle of the wake it is the other way<br />
around. In both cases the URANS modelled spectra are<br />
almost the same for all grid resolutions. Also the wave<br />
number range of the transition region between large<br />
scale range and inertial subrange which corresponds to<br />
κ e is in good agreement to the DDES spectra.<br />
In position C the large differences of k in the<br />
URANS simulations give a very dissimilar description<br />
204
a)<br />
b)<br />
c)<br />
10 0<br />
E 11<br />
10 -1<br />
DDES ∆ = 0.5% c<br />
10 2 SST ∆ = 0.5% c<br />
10 1<br />
SST ∆ = 1.0% c<br />
SST ∆ = 2.0% c<br />
10 -2<br />
10 -3<br />
10 -4<br />
10 -5<br />
10 -1<br />
10<br />
E -2<br />
11<br />
10 -3<br />
10 -4<br />
10 -5<br />
10 -6<br />
E<br />
10 -4<br />
11<br />
10 -5<br />
Position A<br />
x = 1.212c<br />
z = 0.121c<br />
10 0 10 1 10 2 κ<br />
10 3 10 4 10 5<br />
1<br />
DDES ∆ = 0.5% c<br />
10 1 SST ∆ = 0.5% c<br />
10 0<br />
SST ∆ = 1.0% c<br />
SST ∆ = 2.0% c<br />
10 -3<br />
10 -6<br />
10 -7<br />
10 -8<br />
10 -9<br />
Position B<br />
x = 3.375c<br />
z = 0.606c<br />
10 0 10 1 10 2 κ<br />
10 3 10 4 10 5<br />
1<br />
-1 DDES ∆ = 0.5% c<br />
10<br />
SST ∆ = 0.5% c<br />
10 -2<br />
SST ∆ = 1.0% c<br />
SST ∆ = 2.0% c<br />
Position C<br />
x = 3.375c<br />
z = 1.220c<br />
10 0 10 1 10 2 10 3 κ<br />
10 4 10 5 10 6<br />
1<br />
Figure 11. E 11 (κ 1 ) from DDES and turbulent<br />
fluctuation spectrum model at positions A, B and C<br />
of the flow and cannot be used for detailed analysis.<br />
Also the very low velocity fluctuations in the DDES<br />
are not useful for spectral evaluation. Nevertheless the<br />
pressure fluctuation spectrum from DDES matches the<br />
experimental measurement as shown in the previous<br />
section. This fact leads to the assumption that even<br />
if the turbulent wake passes by a certain point in such<br />
a way that the turbulent vortices are not recognisable<br />
in the local velocity, still you can find a significant<br />
footprint of the turbulent structures in the pressure.<br />
5. CONCLUSIONS<br />
The presented studies revealed the ability of<br />
URANS and DDES calculations to propagate turbulent<br />
vortical structures on structured meshes in the wake<br />
of the flow past an airfoil in low-speed stall. The<br />
dissipation of coherent turbulent structures strongly<br />
depends on the local grid cell size in the wake region.<br />
While URANS simulates big discrete periodically<br />
shed vortices, DDES shows a continuously forming<br />
of turbulent 3d structures of different scales in the<br />
wake. Hence evaluated pressure spectra from URANS<br />
simulations base on the fundamental frequency of the<br />
periodic vortex shedding pattern and its harmonics,<br />
whereas DDES calculations give a smooth spectrum<br />
which fits the experimental measurements better.<br />
The turbulent spectrum model based on URANS<br />
turbulence model entities is able to give a rough<br />
estimate of the velocity fluctuation spectrum, at least<br />
the wave number of the most energy containing eddies.<br />
Furthermore it could be observed that on the<br />
boarder of the wake virtually no meaningful velocity<br />
spectrum could be derived from the DDES results,<br />
while the measurable pressure fluctuations fit the<br />
experimental data. This can be of relevance when<br />
simulating the wake of an aircraft with boundary layer<br />
separation occurring at the inner wing sections. Even<br />
when the wake of the separation passes underneath<br />
the htp it can have an effect on the surface pressure<br />
distribution and cause unsteady fluctuations in the<br />
integral forces.<br />
ACKNOWLEDGEMENTS<br />
The presented studies are part of the HINVA<br />
and the ComFliTe project funded by the “German<br />
Federal Ministry of Economics and Technology”.<br />
Computational resources were kindly provided by the<br />
“Leibniz Supercomputing Center” Munich during the<br />
DEISA 2 call and the “High Performance Computing<br />
Center Stuttgart” within the bwGRiD project [27].<br />
REFERENCES<br />
[1] Havas, J., and Jenaro Rabadan, G., 2009,<br />
“Prediction of Horizontal Tail Plane Buffeting<br />
Loads”, Technical Report IFASD-2009-128.<br />
[2] Whitney, M. J., Seitz, T. J., and Blades,<br />
E. L., 2009, “Low-Speed-Stall Tail Buffet Loads<br />
Estimation Using Unsteady CFD”, Technical<br />
Report IFASD-2009-127.<br />
[3] Rudnik, R., Reckzeh, D., and Quest, J.,<br />
2012, “HINVA - High lift INflight VAlidation<br />
- Project Overview and Status”, Proc. 50th<br />
AIAA Aerospace Sciences Meeting including the<br />
New Horizons Forum and Aerospace Exposition,<br />
Nashville, TN, AIAA-2012-0106.<br />
[4] Seifert, A., and Pack, L. G., 1999, “Oscillatory<br />
Excitation of Unsteady Compressible Flows over<br />
Airfoils at Flight Reynolds Numbers”, Technical<br />
Report AIAA-99-0925.<br />
[5] Wokoeck, R., Grote, A., Krimmelbein, N.,<br />
Ortmanns, J., Radespiel, R., and Krumbein, A.,<br />
2006, “RANS Simulation and Experiments on the<br />
Stall Behaviour of a Tailplane Airfoil”, in New<br />
Results in Numerical and Experimental Fluid<br />
205
Mechanics V (Rath, H.-J., Holze, C., Heinemann,<br />
H.-J., Henke, R., and Hönlinger, H., Eds.), Notes<br />
Num Fluid Mech and Multidisciplinary Design,<br />
Vol. 92, pp. 208–216.<br />
[6] Lopez Mejia, O. D., Moser, R. D., Brzozowski,<br />
D. P., and Glezer, A., 2011, “Effects of<br />
Trailing-Edge Synthetic Jet Actuation on an<br />
Airfoil”, AIAA J, Vol. 49(8), pp. 1763–1777.<br />
[7] Weinman, K., 2006, “NACA0012 beyond Stall”,<br />
in FLOMANIA – A European Initiative on Flow<br />
Physics Modelling (Haase, W., Aupoix, B.,<br />
Burge, U., and Schwammborn, D., Eds.), pp.<br />
233–246.<br />
[8] Garbaruk, A., Shur, M., Strelets, M., and<br />
Travin, A., 2009, “NACA0021 at 60 Incidence”,<br />
in DESider – A European Effort on Hybrid<br />
RANS-LES Modelling (Haase, W., Braza, M., and<br />
Revell, A., Eds.), pp. 127–139.<br />
[9] Illi, S., Lutz, T., and Krämer, E., 2010,<br />
“Simulation of Pressure and Shock Induced<br />
Separation using DES Implementations in the<br />
DLR-TAU Code”, Proc. Second Symposium<br />
“Simulation of Wing and Nacelle Stall”,<br />
Braunschweig, Germany, pp. 127–139.<br />
[10] Deck, S., 2005, “Zonal Detached Eddy<br />
Simulation of the Flow around a High-Lift<br />
Configuration”, AIAA J, Vol. 43(11), pp.<br />
2372–2384.<br />
[11] Deck, S., 2009, “Three-Element Airfoil”, in<br />
DESider - A European Effort on Hybrid<br />
RANS-LES Modelling (Haase, W., Braza, M., and<br />
Revell, A., Eds.), pp. 156–163.<br />
[12] Deck, S., 2011, “Recent Improvements in<br />
the Zonal Detached Eddy Simulation (ZDES)<br />
Formulation”, Theor Comp Fluid Dyn, pp. 1–28.<br />
[13] Brunet, V., and Deck, S., 2008, “Zonal-Detached<br />
Eddy Simulation of Transonic Buffet on a Civil<br />
Aircraft Type Configuration”, in Advances in<br />
Hybrid RANS-LES Modelling (Peng, S.-H., and<br />
Haase, W., Eds.), Notes Num Fluid Mech and<br />
Multidisciplinary Design, Vol. 97, pp. 182–191.<br />
[14] Nagy, L., Lohász, M. M., Régert, T., and Vad, J.,<br />
2008, “Hybrid/Zonal RANS/LES Computation of<br />
an Airfoil”, Proc. 6th International Conference<br />
on Mechanical Engineering (Gépészet 2008),<br />
Budapest, Hungary.<br />
[15] Durrani, N., and Qin, N., 2011, “Behavior<br />
of Detached-Eddy Simulations for Mild Airfoil<br />
Trailing-Edge Separation”, J Aircraft, Vol. 48(1),<br />
pp. 193–202.<br />
[16] Probst, A., and Radespiel, R., 2010, “A<br />
Comparison of Detached-Eddy Simulation<br />
and Reynolds-Stress Modelling Applied to the<br />
Flow over a Backward-Facing Step and an<br />
Airfoil at Stall”, Proc. 48th AIAA Aerospace<br />
Sciences Meeting including the New Horizons<br />
Forum and Aerospace Exposition, Orlando, FL,<br />
AIAA-2010-920.<br />
[17] Lehmkuhl, O., Baez, A., Rodríguez, I., and<br />
Pérez-Segarra, C. D., 2011, “Direct Numerical<br />
Simulation and Large-Eddy Simulations of the<br />
Turbulent Flow around a NACA0012 Airfoil”,<br />
Proc. 7th International Conference on Comp.<br />
Heat and Mass Transfer, Istanbul, Turkey.<br />
[18] Pope, S. B., 2011, Turbulent Flows, Cambridge<br />
University Press.<br />
[19] Lysack, P. D., and Brungart, T. A., 2003,<br />
“Velocity Spectrum Model for Turbulence<br />
Ingestion Noise from Computational-Fluid-<br />
Dynamics Calculations”, AIAA J, Vol. 41(9), pp.<br />
1827–1829.<br />
[20] Blazek, J., 2005, Computational Fluid Dynamics:<br />
Principles and Applications, Elsevier, 2nd edn.<br />
[21] Menter, F. R., 1994, “Two-Equation Eddy-<br />
Viscosity Turbulence Models for Engineering<br />
Applications”, AIAA J, Vol. 32(8), pp.<br />
1598–1605.<br />
[22] Spalart, P. R., Deck, S., Shur, M. L., Squires,<br />
K. D., Strelets, M. K., and Travin, A., 2006,<br />
“A New Version of Detached-Eddy Simulation,<br />
Resistant to Ambiguous Grid Densities”, Theor<br />
Comp Fluid Dyn, Vol. 20(3), pp. 181–195.<br />
[23] German Aerospace Center (DLR), 2011,<br />
TAU-Code User Guide, Release 2011.1.0.<br />
[24] Spalart, P. R., and Allmaras, S. R., 1992,<br />
“A One-Equation Turbulence Model for<br />
Aerodynamic Flows”, Technical Report<br />
AIAA-92-0439.<br />
[25] Ladson, C. L., Hill, A. S., and Johnson,<br />
W. G., Jr., 1987, “Pressure Distributions from<br />
High Reynolds Number Transonic Tests of an<br />
NACA 0012 Airfoil in the Langley 0.3-Meter<br />
Transonic Cryogenic Tunnel”, Technical Report<br />
NASA-100526.<br />
[26] Illi, S., Gansel, P. P., Lutz, T., and Krämer, E.,<br />
2012, “Hybrid RANS-LES Wake Studies of an<br />
Airfoil in Stall”, submitted to CEAS Aeronaut J.<br />
[27] http://www.bw-grid.de, member of the German<br />
D-Grid initiative, funded by the “Federal<br />
Ministry for Education and Research” and<br />
the “Ministry for Science, Research and Arts<br />
Baden-Württemberg”.<br />
206