

OES Annual Report 2012 - Ocean Energy Systems
OES Annual Report 2012 - Ocean Energy Systems
OES Annual Report 2012 - Ocean Energy Systems

Create successful ePaper yourself
Turn your PDF publications into a flip-book with our unique Google optimized e-Paper software.
109<br />
05 / DEVELOPMENT OF THE INTERNATIONAL<br />
OCEAN ENERGY INDUSTRY: PERFORMANCE<br />
IMPROVEMENTS AND COST REDUCTIONS<br />
The key challenge in predicting commercial opening costs in the wave energy sector is acquiring meaningful<br />
data. Very few data points are available from actual deployments, and all existing data points come from<br />
pilot demonstration projects, not larger-scale farms.<br />
The following section discusses uncertainties inherent in the cost assessment process.<br />
Uncertainties in Cost and Economic Assessments<br />
It is important to understand that most cost assessments carried out to date were based on projected costs<br />
and were not derived from direct project experience. The reliance on projected costs leads to uncertainties<br />
in the cost assessment process that can be substantial and also that depend on the stage of development of<br />
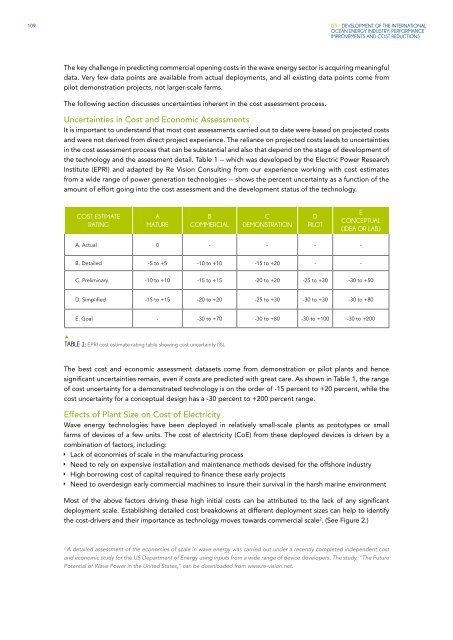
the technology and the assessment detail. Table 1 -- which was developed by the Electric Power Research<br />
Institute (EPRI) and adapted by Re Vision Consulting from our experience working with cost estimates<br />
from a wide range of power generation technologies -- shows the percent uncertainty as a function of the<br />
amount of effort going into the cost assessment and the development status of the technology.<br />
COST ESTIMATE<br />
RATING<br />
A<br />
MATURE<br />
B<br />
COMMERCIAL<br />
C<br />
DEMONSTRATION<br />
D<br />
PILOT<br />
E<br />
CONCEPTUAL<br />
(IDEA OR LAB)<br />
A. Actual 0 - - - -<br />
B. Detailed -5 to +5 -10 to +10 -15 to +20 - -<br />
C. Preliminary -10 to +10 -15 to +15 -20 to +20 -25 to +30 -30 to +50<br />
D. Simplified -15 to +15 -20 to +20 -25 to +30 -30 to +30 -30 to +80<br />
E. Goal - -30 to +70 -30 to +80 -30 to +100 -30 to +200<br />
TABLE 1: EPRI cost estimate rating table showing cost uncertainty (%).<br />
The best cost and economic assessment datasets come from demonstration or pilot plants and hence<br />
significant uncertainties remain, even if costs are predicted with great care. As shown in Table 1, the range<br />
of cost uncertainty for a demonstrated technology is on the order of -15 percent to +20 percent, while the<br />
cost uncertainty for a conceptual design has a -30 percent to +200 percent range.<br />
Effects of Plant Size on Cost of Electricity<br />
Wave energy technologies have been deployed in relatively small-scale plants as prototypes or small<br />
farms of devices of a few units. The cost of electricity (CoE) from these deployed devices is driven by a<br />
combination of factors, including:<br />
ÌÌ<br />
Lack of economies of scale in the manufacturing process<br />
ÌÌ<br />
Need to rely on expensive installation and maintenance methods devised for the offshore industry<br />
ÌÌ<br />
High borrowing cost of capital required to finance these early projects<br />
ÌÌ<br />
Need to overdesign early commercial machines to insure their survival in the harsh marine environment<br />
Most of the above factors driving these high initial costs can be attributed to the lack of any significant<br />
deployment scale. Establishing detailed cost breakdowns at different deployment sizes can help to identify<br />
the cost-drivers and their importance as technology moves towards commercial scale 2 . (See Figure 2.)<br />
2<br />
A detailed assessment of the economies of scale in wave energy was carried out under a recently completed independent cost<br />
and economic study for the US Department of <strong>Energy</strong> using inputs from a wide range of device developers. The study, “The Future<br />
Potential of Wave Power in the United States,” can be downloaded from www.re-vision.net.


