

OES Annual Report 2012 - Ocean Energy Systems
OES Annual Report 2012 - Ocean Energy Systems
OES Annual Report 2012 - Ocean Energy Systems

Create successful ePaper yourself
Turn your PDF publications into a flip-book with our unique Google optimized e-Paper software.
111<br />
05 / DEVELOPMENT OF THE INTERNATIONAL<br />
OCEAN ENERGY INDUSTRY: PERFORMANCE<br />
IMPROVEMENTS AND COST REDUCTIONS<br />
The cumulative effects of moving to larger-scale farms reduce the CoE by approximately 50 percent, without<br />
considering any technology innovations, as illustrated in Table 2. CoE in this case was calculated using a<br />
fixed charge rate (FCR) of 12.4 percent and a project life of 20 years. This is typical for commercial, mature,<br />
utility-scale power projects in the United States. The power-density at the reference deployment location to<br />
compute device performance is 34 kW/m.<br />
PLANT CAPACITY<br />
5 MW 20 MW 50 MW<br />
CAPEX $6,912 $5,035 $4,347<br />
OPEX $438 $239 $162<br />
O&M percent of CAPEX 6.3% 4.7% 3.7%<br />
PERFORMANCE 5 MW 20 MW 50 MW<br />
Capacity factor 30% 30% 30%<br />
Availability 95% 95% 95%<br />
COE (¢/KWH) 5 MW 20 MW 50 MW<br />
CAPEX Contribution 30 22 19<br />
O&M Contribution 22 12 8<br />
Total 52 34 27<br />
TABLE 2: Reference cost and<br />
economic profile from aggregated data<br />
and techno-economic modeling<br />
It is important to point out that the CoE in this study was computed using a utility generator CoE model, with<br />
returns on capital seen typically in utility-scale power plants, hence the study does not consider the impact<br />
on higher capital borrowing costs that are typical for immature technologies. In reality, there would be a risk<br />
premium paid by the developer at smaller-scale plants.<br />
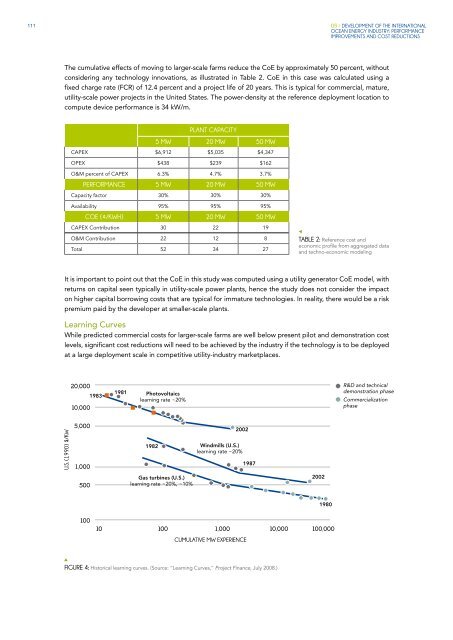
Learning Curves<br />
While predicted commercial costs for larger-scale farms are well below present pilot and demonstration cost<br />
levels, significant cost reductions will need to be achieved by the industry if the technology is to be deployed<br />
at a large deployment scale in competitive utility-industry marketplaces.<br />
20,000<br />
1983<br />
10,000<br />
1981<br />
Photovoltaics<br />
learning rate ~20%<br />
R&D and technical<br />
demonstration phase<br />
Commercialization<br />
phase<br />
U.S. (1990) $/KW<br />
5,000<br />
1,000<br />
1982<br />
2002<br />
Windmills (U.S.)<br />
learning rate ~20%<br />
1987<br />
500<br />
Gas turbines (U.S.)<br />
learning rate ~20%, ~10%<br />
2002<br />
1980<br />
100<br />
10 100<br />
1,000<br />
10,000 100,000<br />
CUMULATIVE MW EXPERIENCE<br />
FIGURE 4: Historical learning curves. (Source: “Learning Curves,” Project Finance, July 2008.)


