

OES Annual Report 2012 - Ocean Energy Systems
OES Annual Report 2012 - Ocean Energy Systems
OES Annual Report 2012 - Ocean Energy Systems

Create successful ePaper yourself
Turn your PDF publications into a flip-book with our unique Google optimized e-Paper software.
110<br />
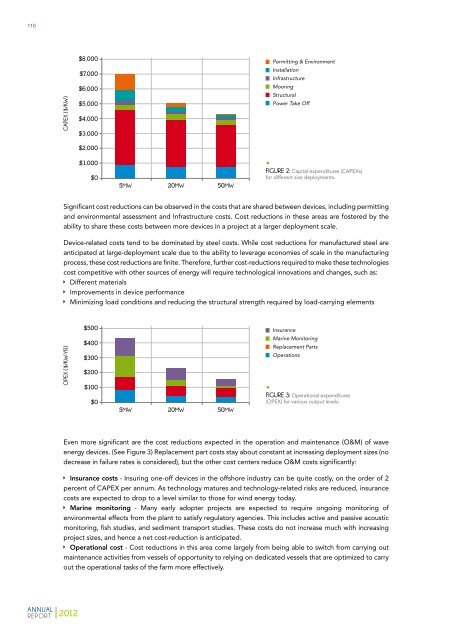
CAPEX ($/KW)<br />
$8,000<br />
$7,000<br />
$6,000<br />
$5,000<br />
$4,000<br />
$3,000<br />
$2,000<br />
Permitting & Environment<br />
Installation<br />
Infrastructure<br />
Mooring<br />
Structural<br />
Power Take Off<br />
$1,000<br />
$0<br />
5MW<br />
20MW<br />
50MW<br />
FIGURE 2: Capital expenditures (CAPEXs)<br />
for different size deployments.<br />
Significant cost reductions can be observed in the costs that are shared between devices, including permitting<br />
and environmental assessment and Infrastructure costs. Cost reductions in these areas are fostered by the<br />
ability to share these costs between more devices in a project at a larger deployment scale.<br />
Device-related costs tend to be dominated by steel costs. While cost reductions for manufactured steel are<br />
anticipated at large-deployment scale due to the ability to leverage economies of scale in the manufacturing<br />
process, these cost reductions are finite. Therefore, further cost-reductions required to make these technologies<br />
cost competitive with other sources of energy will require technological innovations and changes, such as:<br />
ÌÌ<br />
Different materials<br />
ÌÌ<br />
Improvements in device performance<br />
ÌÌ<br />
Minimizing load conditions and reducing the structural strength required by load-carrying elements<br />
OPEX ($/KW-YR)<br />
$500<br />
$400<br />
$300<br />
$200<br />
$100<br />
$0<br />
5MW<br />
20MW<br />
50MW<br />
Insurance<br />
Marine Monitoring<br />
Replacement Parts<br />
Operations<br />
FIGURE 3: Operational expenditures<br />
(OPEX) for various output levels.<br />
Even more significant are the cost reductions expected in the operation and maintenance (O&M) of wave<br />
energy devices. (See Figure 3) Replacement part costs stay about constant at increasing deployment sizes (no<br />
decrease in failure rates is considered), but the other cost centers reduce O&M costs significantly:<br />
ÌÌ<br />
Insurance costs - Insuring one-off devices in the offshore industry can be quite costly, on the order of 2<br />
percent of CAPEX per annum. As technology matures and technology-related risks are reduced, insurance<br />
costs are expected to drop to a level similar to those for wind energy today.<br />
ÌÌ<br />
Marine monitoring - Many early adopter projects are expected to require ongoing monitoring of<br />
environmental effects from the plant to satisfy regulatory agencies. This includes active and passive acoustic<br />
monitoring, fish studies, and sediment transport studies. These costs do not increase much with increasing<br />
project sizes, and hence a net cost-reduction is anticipated.<br />
ÌÌ<br />
Operational cost - Cost reductions in this area come largely from being able to switch from carrying out<br />
maintenance activities from vessels of opportunity to relying on dedicated vessels that are optimized to carry<br />
out the operational tasks of the farm more effectively.<br />
ANNUAL<br />
REPORT <strong>2012</strong>


