Twice a Year Scientific Journal
Twice a Year Scientific Journal
Twice a Year Scientific Journal

Create successful ePaper yourself
Turn your PDF publications into a flip-book with our unique Google optimized e-Paper software.
Tej, J., Economic Assessment of Selected Bank Mergers, EA (2010, Vol. 43, No, 1-2, 34-43) 37<br />
interest for the proper operation of the institution not to lose this money, but to maximize<br />
their value.<br />
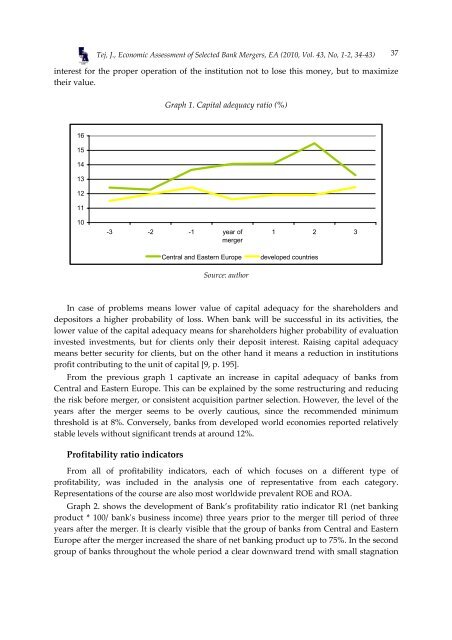
Graph 1. Capital adequacy ratio (%)<br />
16<br />
15<br />
14<br />
13<br />
12<br />
11<br />
10<br />
-3 -2 -1 year of<br />
merger<br />
Central and Eastern Europe<br />
Source: author<br />
1 2 3<br />
developed countries<br />
In case of problems means lower value of capital adequacy for the shareholders and<br />
depositors a higher probability of loss. When bank will be successful in its activities, the<br />
lower value of the capital adequacy means for shareholders higher probability of evaluation<br />
invested investments, but for clients only their deposit interest. Raising capital adequacy<br />
means better security for clients, but on the other hand it means a reduction in institutions<br />
profit contributing to the unit of capital [9, p. 195].<br />
From the previous graph 1 captivate an increase in capital adequacy of banks from<br />
Central and Eastern Europe. This can be explained by the some restructuring and reducing<br />
the risk before merger, or consistent acquisition partner selection. However, the level of the<br />
years after the merger seems to be overly cautious, since the recommended minimum<br />
threshold is at 8%. Conversely, banks from developed world economies reported relatively<br />
stable levels without significant trends at around 12%.<br />
Profitability ratio indicators<br />
From all of profitability indicators, each of which focuses on a different type of<br />
profitability, was included in the analysis one of representative from each category.<br />
Representations of the course are also most worldwide prevalent ROE and ROA.<br />
Graph 2. shows the development of Bank’s profitability ratio indicator R1 (net banking<br />
product * 100/ bankʹs business income) three years prior to the merger till period of three<br />
years after the merger. It is clearly visible that the group of banks from Central and Eastern<br />
Europe after the merger increased the share of net banking product up to 75%. In the second<br />
group of banks throughout the whole period a clear downward trend with small stagnation