Twice a Year Scientific Journal
Twice a Year Scientific Journal
Twice a Year Scientific Journal

You also want an ePaper? Increase the reach of your titles
YUMPU automatically turns print PDFs into web optimized ePapers that Google loves.
42<br />
Economic Analysis (2010, Vol. 43, No. 1-2, 34-43)<br />
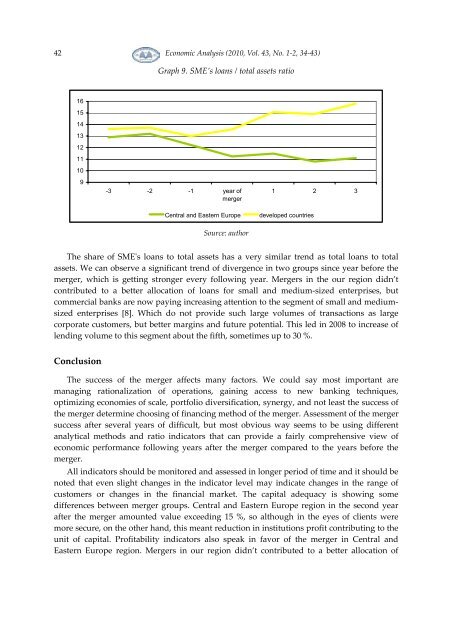
Graph 9. SME’s loans / total assets ratio<br />
16<br />
15<br />
14<br />
13<br />
12<br />
11<br />
10<br />
9<br />
-3 -2 -1 year of<br />
merger<br />
Central and Eastern Europe<br />
Source: author<br />
1 2 3<br />
developed countries<br />
The share of SMEʹs loans to total assets has a very similar trend as total loans to total<br />
assets. We can observe a significant trend of divergence in two groups since year before the<br />
merger, which is getting stronger every following year. Mergers in the our region didn’t<br />
contributed to a better allocation of loans for small and medium-sized enterprises, but<br />
commercial banks are now paying increasing attention to the segment of small and mediumsized<br />
enterprises [8]. Which do not provide such large volumes of transactions as large<br />
corporate customers, but better margins and future potential. This led in 2008 to increase of<br />
lending volume to this segment about the fifth, sometimes up to 30 %.<br />
Conclusion<br />
The success of the merger affects many factors. We could say most important are<br />
managing rationalization of operations, gaining access to new banking techniques,<br />
optimizing economies of scale, portfolio diversification, synergy, and not least the success of<br />
the merger determine choosing of financing method of the merger. Assessment of the merger<br />
success after several years of difficult, but most obvious way seems to be using different<br />
analytical methods and ratio indicators that can provide a fairly comprehensive view of<br />
economic performance following years after the merger compared to the years before the<br />
merger.<br />
All indicators should be monitored and assessed in longer period of time and it should be<br />
noted that even slight changes in the indicator level may indicate changes in the range of<br />
customers or changes in the financial market. The capital adequacy is showing some<br />
differences between merger groups. Central and Eastern Europe region in the second year<br />
after the merger amounted value exceeding 15 %, so although in the eyes of clients were<br />
more secure, on the other hand, this meant reduction in institutions profit contributing to the<br />
unit of capital. Profitability indicators also speak in favor of the merger in Central and<br />
Eastern Europe region. Mergers in our region didn’t contributed to a better allocation of